This list is a comprehensive collection of statistical methods used in project management is to achieve project goals.
Project management tools
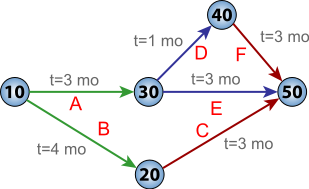
- Critical path method (CPM) is an algorithm for scheduling a set of project activities in a straight line.
- Critical chain project management is a method of planning and managing projects that emphasizes the resources required to execute project tasks.
- Program Evaluation and Review Technique, commonly abbreviated PERT, is a statistical tool, used in project management, that is designed to analyze and represent the tasks involved in completing a given project.
- Activity diagrams are graphical representations of workflows of stepwise activities and actions with support for choice, iteration and concurrency.
- Beta distribution is a combination of probability theory and statistics, most commonly used in project management for time allocation and to analyse random variables.
- Critical path drag is a project management metric used to schedule analysis and compression in the critical path method of scheduling.
- Drag cost is the reduction in the expected return on investment for a project due to an activity's or constraint's critical path drag. It is often used to justify additional resources that cost less than the drag cost.
- Event chain diagrams are visualizations that show the relationships between events and tasks and how the events affect each other.
- Earned value management is a project management technique for measuring project performance and progress in terms of deducing earned value of a project from planned value and the actual costs.
- Program Evaluation and Review Technique, commonly abbreviated PERT, is a statistical tool, used in project management to analyze and represent the tasks involved in completing a given project.

- work breakdown structure, A work breakdown structure (WBS), in project management is a deliverable oriented decomposition of a project into smaller components.
- A Gantt chart is a type of bar chart, that illustrates a project schedule.
- Design structure matrix is a simple, compact and visual representation of a system or project in the form of a matrix. It is the equivalent of an adjacency matrix in graph theory, and is used in project management to model the structure of complex systems or processes, in order to perform system analysis, project planning and organization design.
- Project network is a graph (flow chart) depicting the sequence in which a project's terminal elements are to be completed by showing terminal elements and their dependencies.
- Triangular distribution – In probability theory and statistics, the triangular distribution is a continuous probability distribution with lower limit a, upper limit b and mode c, where a < b and a ≤ c ≤ b.
- Graphical Evaluation and Review Technique, commonly known as GERT, is a network analysis technique used in project management that allows probabilistic treatment of both network logic and estimation of activity duration
- Capability Maturity Model, a statistical model converts ad hoc practices in to formally defined steps, to managed result metrics, resulting in active optimization of the processes.
- Integrated master plan is an event-driven plan document depicting the significant accomplishments necessary to complete the work and ties each accomplishment to a key program event
- Linear scheduling method is a graphical scheduling method focusing on continuous resource utilization in repetitive activities.
- Predictive analytics encompasses a variety of statistical techniques from modeling, machine learning, and data mining that analyze current and historical facts to make predictions about future, or otherwise unknown, events .