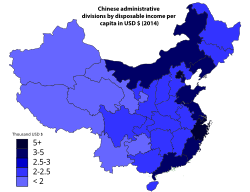
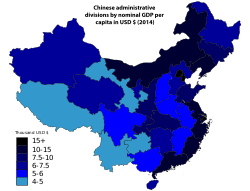
| Province-level divisions of China by: |
|---|
This is a list of the first-level administrative divisions of the People's Republic of China (PRC), including all provinces, autonomous regions and municipalities, in order of their total disposable income per capita in 2023. The figures are given in Renminbi. Hong Kong SAR, and Macau SAR are excluded.


Disposable income is total personal income minus personal current taxes. In national accounts definitions, personal income, minus personal current taxes equals disposable personal income. Subtracting personal outlays (which includes the major category of personal (or, private) consumption expenditure) yields personal (or, private) savings.
In 2023, the average exchange rate between RMB (CNY) and USD is 7.0467:1.
| 2023 Rank | Province | Disposable income per capita RMB¥ | Disposable income per capita USD$ | Nominal GDP per capita USD$ | Average household size | Disposable income per household RMB¥ | Disposable income per household USD$ |
|---|---|---|---|---|---|---|---|
| 1 | Shanghai | 84,834 | 12,039 | 27,001 | 2.32 | 196,815 | 27,930 |
| 2 | Beijing | 81,752 | 11,601 | 28,421 | 2.31 | 188,847 | 26,799 |
| 3 | Zhejiang | 63,830 | 9,058 | 17,745 | 2.35 | 150,001 | 21,287 |
| 4 | Jiangsu | 52,674 | 7,475 | 21,356 | 2.60 | 136,952 | 19,435 |
| 5 | Tianjin | 51,271 | 7,276 | 17,420 | 2.40 | 123,050 | 17,462 |
| 6 | Guangdong | 49,327 | 7,000 | 15,182 | 2.63 | 129,730 | 18,410 |
| 7 | Fujian | 45,426 | 6,446 | 18,429 | 2.68 | 121,742 | 17,276 |
| 8 | Shandong | 39,890 | 5,661 | 12,881 | 2.70 | 107,703 | 15,284 |
| — | 39,218 | 5,565 | 12,681 | 2.62 | 102,751 | 14,581 | |
| 9 | Inner Mongolia | 38,130 | 5,411 | 14,571 | 2.35 | 89,606 | 12,716 |
| 10 | Liaoning | 37,992 | 5,391 | 10,233 | 2.29 | 87,002 | 12,346 |
| 11 | Chongqing | 37,595 | 5,335 | 13,359 | 2.45 | 92,108 | 13,071 |
| 12 | Hunan | 35,895 | 5,094 | 10,776 | 2.67 | 95,840 | 13,601 |
| 13 | Hubei | 35,146 | 4,988 | 13,558 | 2.65 | 93,137 | 13,217 |
| 14 | Anhui | 34,893 | 4,952 | 10,903 | 2.61 | 91,071 | 12,924 |
| 15 | Jiangxi | 34,242 | 4,859 | 10,106 | 2.94 | 100,671 | 14,286 |
| 16 | Hainan | 33,192 | 4,710 | 10,353 | 3.06 | 101,568 | 14,413 |
| 17 | Hebei | 32,903 | 4,669 | 8,420 | 2.75 | 90,483 | 11,581 |
| 18 | Sichuan | 32,514 | 4,614 | 10,194 | 2.51 | 81,610 | 11,581 |
| 19 | Shaanxi | 32,128 | 4,559 | 12,126 | 2.53 | 81,284 | 11,535 |
| 20 | Ningxia | 31,604 | 4,485 | 10,353 | 2.65 | 83,751 | 11,885 |
| 21 | Shanxi | 30,924 | 4,388 | 10,499 | 2.52 | 77,928 | 11,059 |
| 22 | Henan | 29,933 | 4,248 | 8,525 | 2.86 | 85,608 | 12,149 |
| 23 | Jilin | 29,797 | 4,229 | 7,762 | 2.34 | 69,725 | 9,895 |
| 24 | Heilongjiang | 29,694 | 4,214 | 7,317 | 2.22 | 65,921 | 9,355 |
| 25 | Guangxi | 29,514 | 4,188 | 7,664 | 2.87 | 84,705 | 12,021 |
| 26 | Tibet | 28,983 | 4,113 | 9,315 | 3.19 | 92,456 | 13,120 |
| 27 | Xinjiang | 28,947 | 4,108 | 10,469 | N/A | N/A | |
| 28 | Qinghai | 28,587 | 4,057 | 9,069 | 2.79 | 79,758 | 11,318 |
| 29 | Yunnan | 28,421 | 4,033 | 9,097 | 2.88 | 81,852 | 11,616 |
| 30 | Guizhou | 27,098 | 3,845 | 7,688 | 2.81 | 76,145 | 10,806 |
| 31 | Gansu | 25,011 | 3,549 | 6,793 | 2.77 | 69,280 | 9,832 |
External links
| Lists of countries by GDP rankings | |
|---|---|
| Nominal | |
| Purchasing power parity (PPP) | |
| Growth rate | |
| Gross national income (GNI) | |
| Countries by region |
|
| Subnational divisions |
*Top country subdivisions by GDP *Top country subdivisions by GDP per capita *Top country metropolitan by GDP |
notes
- 2020 census data
- No data