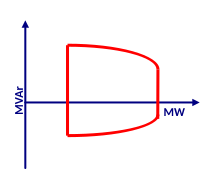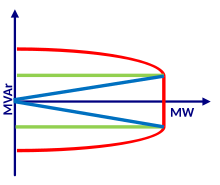
Capability curve of an electrical generator describes the limits of the active (MW) and reactive power (MVAr) that the generator can provide. The curve represents a boundary of all operating points in the MW/MVAr plane; it is typically drawn with the real power on the horizontal axis, and, for the synchronous generator, resembles a letter D in shape, thus another name for the same curve, D-curve. In some sources the axes are switched, and the curve gets a dome-shaped appearance.
Synchronous generators
For a traditional synchronous generator the curve consists of multiple segments, each due to some physical constraint:
- at the right part of the curve (close to the rated voltage), the generator is constrained by the heat dissipation in the armature (stator for large generators). The heating is proportional to the sum of squares of active and reactive currents, at the near-constant voltage it is closely proportional to the sum of squares of MW and MVAr, therefore this part of the curve (armature heating limit) resembles a section of a semicircle with the center at (0,0);
- at the upper part of the curve (generator produces a lot of reactive power) operation requires higher voltage on the output of the generator and thus higher excitation field. The rotating excitation winding has its own field heating limit;
- at the bottom of the curve (generator absorbs a lot of reactive power) the magnetic flux constraints in the stator cause heating of the magnetic core at the stator end (core end heating limit).
The corners between the sections of the curve define the limits of the power factor (PF) that the generator can sustain at its nameplate capacity (the illustration has the PF ticks placed at 0.85 lagging and 0.95 leading angles). In practice, the prime mover (a power source that drives the generator) is designed for less active power than the generator is capable of (due to the fact that in real life generator always has to deliver some reactive power), so a prime mover limit (a vertical dashed line on the illustration) changes the constraints somewhat (in the example, the leading PF limit, now at the intersection of the prime mover limit and core end heating limit, lowers to 0.93.
Due to high cost of a generator, a set of sensors and limiters will trigger the alarm when the generator approaches the capability-set boundary and, if no action is taken by the operator, will disconnect the generator from the grid.

The D-curve for a particular generator can be expanded by improved cooling. Hydrogen-cooled turbo generator's cooling can be improved by increasing the hydrogen pressure, larger generators, from 300 MVA, use more efficient water cooling.

The practical D-curve of a typical synchronous generator has one more limitation, minimum load. The minimum real power requirement means that the left-side of a D-curve is detached from the vertical axis. Although some generators are designed to be able to operate at zero load (as synchronous condensers), operation at real power levels between zero and the minimum is not possible even with these designs.
Wind and solar photovoltaics generators

The inverter-based resources (like solar photovoltaic (PV) generators, doubly-fed induction generators and full-converter wind generators, also known as "Type 3" and "Type 4" turbines) need to have reactive capabilities in order to contribute to the grid stability, yet their contribution is quite different from the synchronous generators and is limited by internal voltage, temperature, and current constraints. Due to flexibility allowed by the presence of the power converter, the doubly-fed and full-converter wind generators on the market have different shapes of the capability curve: "triangular", "rectangular", "D-shape" (the latter one resembles the D-curve of a synchronous generator). The rectangular and D-shapes of the curve theoretically allow using the generator to provide voltage regulation services even when the unit does not produce any active energy (due to low wind or no sun), essentially working as a STATCOM, but not all designs include this feature. The fixed speed wind turbines without a power converter (also known as "Type 1" and "Type 2") cannot be used for voltage control. They simply absorb the reactive power (like any typical induction machine), so a switched capacitor bank is usually used to correct the power factor to unity.

Older PV generators were intended for distribution networks. Since the current state of these networks does not include the voltage regulation, the inverters in these units were operating at the unity power factor. When the PV devices started to appear in the transmission networks, the inverters with reactive power capability appeared on the market. Since the power limit of an invertor is based on the maximum total current, the natural shape of the capability curve is similar to a semicircle, and at full capacity the real power always needs to be lowered if the reactive power is to be produced or absorbed. Theoretically the PV generators can be used as STATCOMs, although in practice the solar plants are disconnected at night.
Effects on electricity pricing
For a synchronous generator operating inside its D-curve, the marginal cost of providing reactive power is close to zero. However, once the generator's operating point reaches the corners of the D-curve, increasing the reactive power output will require reduction of the real (active) power. Since the electricity markets payments are typically based on real power, the generating company will have a disincentive to provide more reactive power if requested by the independent system operator. Therefore the reactive power management (voltage control) is separated into an ancillary service with its own tariffs, like the Reactive Supply and Voltage Control from Generation Sources (GSR) in the US.
References
- ^ Kirby & Hirst 1997, p. 14.
- Staff Report 2005, p. 42.
- ^ Staff Report 2005, p. 43.
- McDowell et al. 2012, p. 12.
- ^ Effatnejad et al. 2017, p. 193.
- McDowell et al. 2012, pp. 13–14.
- ^ McDowell et al. 2012, p. 14.
- McDowell et al. 2012, pp. 14–15.
- McDowell et al. 2012, p. 15.
- Staff Report 2005, p. 96.
- Staff Report 2005, p. 81.
- Kirby & Hirst (1997), p. 3.
Sources
- Kirby, Brendan J.; Hirst, Eric (1997). Ancillary service details: Voltage control (ORNL/CON-453) (PDF). Oak Ridge, Tennessee: Oak Ridge National Laboratory.
- Staff Report (February 4, 2005). Principles for Efficient and Reliable Reactive Power Supply and Consumption (PDF). Washington, D.C.: Federal Energy Regulatory Commission.
- McDowell, Jason; Walling, Reigh; Peter, William; Von Engeln, Edi; Seymour, Eric; Nelson, Robert; Casey, Leo; Ellis, Abraham; Barker, Chris (1 February 2012), Reactive power interconnection requirements for PV and wind plants : recommendations to NERC., Office of Scientific and Technical Information (OSTI), doi:10.2172/1039006
- Effatnejad, Reza; Akhlaghi, Mahdi; Aliyari, Hamed; Zareh, Hamed Modir; Effatnejad, Mohammad (5 April 2017). "Reactive Power Control in Wind Power Plants". In Naser Mahdavi Tabatabaei; Ali Jafari Aghbolaghi; Nicu Bizon; Frede Blaabjerg (eds.). Reactive Power Control in AC Power Systems: Fundamentals and Current Issues. Springer. pp. 191–225. ISBN 978-3-319-51118-4. OCLC 1005810845.
| Characteristics of synchronous machines | |
|---|---|
 with the center at (0,0);