Misplaced Pages

California's 13th congressional district

Article snapshot taken from Wikipedia with creative commons attribution-sharealike license. Give it a read and then ask your questions in the chat. We can research this topic together.
(Redirected from CA-13) U.S. House district for California "CA-13" redirects here. For the state route, see California State Route 13.

37°48′N 122°15′W / 37.8°N 122.25°W / 37.8; -122.25

California's 13th congressional district
Interactive map of district boundaries since 2023 (Used in the 2022 elections)
RepresentativeAdam Gray
DMerced
Population (2023)784,322
Median household
income
$65,557
Ethnicity
Cook PVID+4

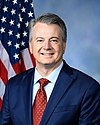
California's 13th congressional district is a congressional district in the U.S. state of California. Adam Gray, a Democrat, has represented this district since January 2025.

In the 2022 redistricting cycle, the district was moved to the San Joaquin Valley, while the old 13th district was renumbered as the 12th. The new 13th district includes all of Merced County; most of the population of Madera County; and parts of Stanislaus, Fresno, and San Joaquin counties. It includes the cities of Merced, Madera, Ceres, Patterson, Lathrop, Chowchilla, Atwater, Coalinga, and Mendota; as well as the southern parts of both Modesto and Turlock. The new 13th district is considered a Democratic-leaning swing district. Despite that, Duarte was narrowly elected to represent it in 2022. As a result, it was one of 18 districts won by Republicans in 2022 that voted for Joe Biden in the 2020 presidential election.

Prior to the 2022 redistricting, the 13th district contained cities in the northwestern portion of Alameda County including Alameda, Albany, Berkeley, Emeryville, Oakland, Piedmont, and San Leandro.

Recent election results from statewide races

Year Office Results
2008 President Obama 54% - 45%
2012 President Obama 55% - 45%
2016 President Clinton 53% - 41%
2018 Governor Newsom 52% - 48%
Attorney General Becerra 55% - 45%
2020 President Biden 54% - 43%
2022 Senate (Reg.) Meuser 51% - 49%
Governor Dahle 54% - 46%
Lt. Governor Underwood Jacobs 53% - 47%
Secretary of State Bernosky 52% - 48%
Attorney General Hochman 53% - 47%
Treasurer Guerrero 53% - 47%
2024 President Trump 51% - 46%
Senate (Reg.) Garvey 52% - 48%

Composition

# County Seat Population
19 Fresno Fresno 1,017,162
39 Madera Madera 162,858
47 Merced Merced 291,920
77 San Joaquin Stockton 800,965
99 Stanislaus Modesto 551,430

Due to the 2020 redistricting, California's 13th congressional district has been moved geographically to the San Joaquin Valley. It encompasses Merced County, and parts of San Joaquin, Stanislaus, Madera, and Fresno Counties.

San Joaquin County is split between this district and the 9th district. They are partitioned by Union Pacific, Highway 380, S Tracy Blvd, the California Aqueduct, S Banta Rd, Highway 5, Paradise Cut, S Manthey Rd, Walthall Slough, E West Ripon Rd, Kincaid Rd, Hutchinson Rd, and Stanislaus River. The 9th district takes in the city of Lathrop.

Stanislaus County is split between this district and the 5th district. They are partitioned by S Golden State Blvd, Highway J14, Union Pacific, Highway 99, N Golden State Blvd, Faith Home Rd, Rohde Rd, Moore Rd, Tuolumne River, Burlington Northern Santa Fe, Lateral No 2 Park, Viola St, Roble Ave, N Conejo Ave, N Carpenter Rd, Kansas Ave, Morse Rd, and Stanislaus River. The 5th district takes in the southern halves of the cities of Modesto and Turlock, the cities of Ceres, Patterson, and Newman, and the census-designated places Empire, Airport, Rouse, Bystrom, Parklawn, Bret Harte, Riverdale Park, West Modesto, Keyes, Cowan, Monterey Park Tract, Grayson, Westley, Crows Landing, and Diablo Grande.

Madera County is split between this district and the 5th district. They are partitioned by Road 35, Road 36, Road 38, Madera Equalization Reservoir, River Rd, Avenue 21, Road 23, Avenue 27, Road 22 1/2, and Berenda Slough. The 13th district takes in the cities of Chowchilla and Madera and the census-desiganted places Fairmead, Madera Acres, Parksdale, Parkwood, La Vina, Bonadelle Ranchos, and Madera Ranchos.

Fresno County is split between this district and the 21st district. They are partitioned by N Dickenson Ave, Highway 180, S Garfield Ave, W California Ave, S Grantland Ave, W Jensen Ave, S Chateau Fresno Ave, W North Ave, W American Ave, S Westlawn Ave, W Lincoln Ave, Shayes Ave, W Sumner Ave, S Cornelia Ave, W South Ave, S East Ave, E Mountain View Ave, S Sunnyside Ave, E Clemenceau Ave, S Fowler Ave, E Elkhorn Ave. The 13th district takes in the cities of Coalinga, Mendota, Kerman, Firebaugh, San Joaquin, and Huron, and the census-designated places Biola, Raisin City, Caruthers, Laton, Riverdale, Lanare, Tranquillity, Three Rocks, Cantua Creek, and Westside.

Cities and CDPs of 10,000 or more people

2,500 – 10,000 people

List of members representing the district

Member Party Dates Cong
ress
Electoral history Counties
District created March 4, 1933

Charles Kramer
(Los Angeles)
Democratic March 4, 1933 –
January 3, 1943
73rd
74th
75th
76th
77th
Elected in 1932.
Re-elected in 1934.
Re-elected in 1936.
Re-elected in 1938.
Re-elected in 1940.
Lost re-election.
1933–1943
[data missing]

Norris Poulson
(Los Angeles)
Republican January 3, 1943 –
January 3, 1945
78th Elected in 1942.
Lost re-election.
1943–1953
[data missing]

Ned R. Healy
(Los Angeles)
Democratic January 3, 1945 –
January 3, 1947
79th Elected in 1944.
Lost re-election.

Norris Poulson
(Los Angeles)
Republican January 3, 1947 –
January 3, 1953
80th
81st
82nd
Elected in 1946.
Re-elected in 1948.
Re-elected in 1950.
Redistricted to the 24th district.

Ernest K. Bramblett
(Pacific Grove)
Republican January 3, 1953 –
January 3, 1955
83rd Redistricted from the 11th district and re-elected in 1952.
Retired.
1953–1963
Monterey, San Luis Obispo, Santa Barbara, Ventura

Charles M. Teague
(Santa Paula)
Republican January 3, 1955 –
January 1, 1974
84th
85th
86th
87th
88th
89th
90th
91st
92nd
93rd
Elected in 1954.
Re-elected in 1956.
Re-elected in 1958.
Re-elected in 1960.
Re-elected in 1962.
Re-elected in 1964.
Re-elected in 1966.
Re-elected in 1968.
Re-elected in 1970.
Re-elected in 1972.
Died.
1963–1967
Santa Barbara, Ventura
1967–1973
Southwestern Los Angeles, Santa Barbara, Ventura
1973–1975
Most of Santa Barbara and Ventura
Vacant January 1, 1974 –
March 5, 1974
93rd

Robert J. Lagomarsino
(Ojai)
Republican March 5, 1974 –
January 3, 1975
Elected to finish Teague's term.
Redistricted to the 19th district.

Norman Mineta
(San Jose)
Democratic January 3, 1975 –
January 3, 1993
94th
95th
96th
97th
98th
99th
100th
101st
102nd
Elected in 1974.
Re-elected in 1976.
Re-elected in 1978.
Re-elected in 1980.
Re-elected in 1982.
Re-elected in 1984.
Re-elected in 1986.
Re-elected in 1988.
Re-elected in 1990.
Redistricted to the 15th district.
1975–1983
Santa Clara
1983–1993
Santa Clara (western San Jose)

Pete Stark
(Fremont)
Democratic January 3, 1993 –
January 3, 2013
103rd
104th
105th
106th
107th
108th
109th
110th
111th
112th
Redistricted from the 9th district and re-elected in 1992.
Re-elected in 1994.
Re-elected in 1996.
Re-elected in 1998.
Re-elected in 2000.
Re-elected in 2002.
Re-elected in 2004.
Re-elected in 2006.
Re-elected in 2008.
Re-elected in 2010.
Redistricted to the 15th district and lost re-election.
1993–2003
Western Alameda, small part of northern Santa Clara
2003–2013

Southwestern Alameda

Barbara Lee
(Oakland)
Democratic January 3, 2013 –
January 3, 2023
113th
114th
115th
116th
117th
Redistricted from the 9th district and re-elected in 2012.
Re-elected in 2014.
Re-elected in 2016.
Re-elected in 2018.
Re-elected in 2020.
Redistricted to the 12th district.
2013–2023

Northern Alameda

John Duarte
(Modesto)
Republican January 3, 2023 –
January 3, 2025
118th Elected in 2022.
Lost re-election.
2023–present

San Joaquin Valley, all of Merced County; including all of Madera parts of Stanislaus, Fresno, and San Joaquin

Adam Gray
(Merced)
Democratic January 3, 2025 –
present
119th Elected in 2024.

Election results

1932193419361938194019421944194619481950195219541956195819601962196419661968197019721974 (Special)19741976197819801982198419861988199019921994199619982000200220042006200820102012201420162018202020222024


1932

1932 United States House of Representatives elections in California
Party Candidate Votes %
Democratic Charles Kramer 65,261 52.7
Republican Charles H. Randall 53,449 43.1
Liberty George D. Higgins 5,237 4.2
Total votes 123,947 100.0
Turnout  
Democratic win (new seat)

1934

1934 United States House of Representatives elections in California
Party Candidate Votes %
Democratic Charles Kramer (Incumbent) 83,384 62.5
Republican Thomas K. Case 27,993 21.0
Prohibition Charles H. Randall 18,760 14.1
Socialist Michael S. Kerrigan 2,113 1.6
Communist John J. Graham 1,268 0.9
Total votes 133,518 100.0
Turnout  
Democratic hold

1936

1936 United States House of Representatives elections in California
Party Candidate Votes %
Democratic Charles Kramer (Incumbent) 119,251 90.0
No party Floyd Seaman (write-in) 6,946 5.2
Communist Emma Cutler 6,362 4.8
Total votes 132,559 100.0
Turnout  
Democratic hold

1938

1938 United States House of Representatives elections in California
Party Candidate Votes %
Democratic Charles Kramer (Incumbent) 96,258 65.9
Republican K. L. Stockton 44,808 30.7
Communist Louis Baron 5,104 3.4
Total votes 146,170 100.0
Turnout  
Democratic hold

1940

1940 United States House of Representatives elections in California
Party Candidate Votes %
Democratic Charles Kramer (Incumbent) 127,167 75.7
Prohibition Charles H. Randall 36,406 21.7
Communist Celeste Strack 4,434 2.6
Total votes 168,007 100.0
Turnout  
Democratic hold

1942

1942 United States House of Representatives elections in California
Party Candidate Votes %
Republican Norris Poulson 38,577 49.5
Democratic Charles Kramer (Incumbent) 33,060 42.4
Townsend Calvert S. Wilson 6,306 8.1
Total votes 77,943 100.0
Turnout  
Republican gain from Democratic

1944

1944 United States House of Representatives elections in California
Party Candidate Votes %
Democratic Ned R. Healy 66,854 55
Republican Norris Poulson (Incumbent) 54,792 45
Total votes 121,646 100
Turnout  
Democratic gain from Republican

1946

1946 United States House of Representatives elections in California
Party Candidate Votes %
Republican Norris Poulson 48,071 51.8
Democratic Ned R. Healy (Incumbent) 44,712 48.2
Total votes 92,783 100.0
Turnout  
Republican gain from Democratic

1948

1948 United States House of Representatives elections in California
Party Candidate Votes %
Republican Norris Poulson (Incumbent) 62,951 52.6
Democratic Ned R. Healy 56,624 47.4
Total votes 119,575 100.0
Turnout  
Republican hold

1950

1950 United States House of Representatives elections in California
Party Candidate Votes %
Republican Norris Poulson (Incumbent) 83,296 84.9
Progressive Ellen P. Davidson 14,789 15.1
Total votes 98,085 100.0
Turnout  
Republican hold

1952

1952 United States House of Representatives elections in California
Party Candidate Votes %
Republican Ernest K. Bramblett (Incumbent) 79,496 51
Democratic Will Hays 76,516 49
Total votes 156,012 100
Turnout  
Republican hold

1954

1954 United States House of Representatives elections in California
Party Candidate Votes %
Republican Charles M. Teague 69,287 52.5
Democratic Timothy I. O'Reilly 62,786 47.5
Total votes 132,073 100.0
Turnout  
Republican hold

1956

1956 United States House of Representatives elections in California
Party Candidate Votes %
Republican Charles M. Teague (Incumbent) 104,009 59.6
Democratic William Kirk Stewart 70,567 40.4
Total votes 174,576 100.0
Turnout  
Republican hold

1958

1958 United States House of Representatives elections in California
Party Candidate Votes %
Republican Charles M. Teague (Incumbent) 98,381 57
Democratic William Kirk Stewart 74,160 43
Total votes 172,541 100
Turnout  
Republican hold

1960

1960 United States House of Representatives elections in California
Party Candidate Votes %
Republican Charles M. Teague (Incumbent) 146,072 65
Democratic George J. Holgate 78,597 35
Total votes 224,669 100
Turnout  
Republican hold

1962

1962 United States House of Representatives elections in California
Party Candidate Votes %
Republican Charles M. Teague (Incumbent) 84,743 64.9
Democratic George J. Holgate 45,746 35.1
Total votes 130,489 100.0
Turnout  
Republican hold

1964

1964 United States House of Representatives elections in California
Party Candidate Votes %
Republican Charles M. Teague (Incumbent) 104,744 57.4
Democratic George E. Taylor 77,763 42.6
Total votes 182,507 100.0
Turnout  
Republican hold

1966

1966 United States House of Representatives elections in California
Party Candidate Votes %
Republican Charles M. Teague (Incumbent) 116,701 67.5
Democratic Charles A. Storke 56,240 32.5
Total votes 172,941 100.0
Turnout  
Republican hold

1968

1968 United States House of Representatives elections in California
Party Candidate Votes %
Republican Charles M. Teague (Incumbent) 148,357 65.9
Democratic Stanley K. Sheinbaum 76,928 34.1
Total votes 225,285 100.0
Turnout  
Republican hold

1970

1970 United States House of Representatives elections in California
Party Candidate Votes %
Republican Charles M. Teague (Incumbent) 125,507 58.2
Democratic Gary K. Hart 87,980 40.8
American Independent Maude I. Jordet 2,339 1.0
Total votes 215,826 100.0
Turnout  
Republican hold

1972

1972 United States House of Representatives elections in California
Party Candidate Votes %
Republican Charles M. Teague (Incumbent) 153,723 73.9
Democratic Lester Dean Cleveland 54,237 27.1
Total votes 207,960 100.0
Turnout  
Republican hold

1974 (Special)

1974 California's 13th congressional district special election
Party Candidate Votes %
Republican Robert J. Lagomarsino 53.7
Democratic James D. Loebl 18.8
Democratic James A. Browning Jr. 7.8
Democratic Roger A. Ikola 6.3
Democratic E.T. "Tom" Jolicoeur 6.0
Democratic David H. Miller 3.2
Democratic R.W. Handley 2.4
Democratic F. Joe Deauchamp 1.9
Total votes 100.0
Turnout  
Republican hold

1974

1974 United States House of Representatives elections in California
Party Candidate Votes %
Democratic Norm Mineta 78,649 52.6
Republican George W. Milias 63,381 42.4
Peace and Freedom Elizabeth Cervantes Barron 3,846 2.6
American Independent Floyd S. Stancliffe 3,738 2.5
Total votes 149,614 100.0
Turnout  
Democratic gain from Republican

1976

1976 United States House of Representatives elections in California
Party Candidate Votes %
Democratic Norm Mineta (Incumbent) 135,291 66.8
Republican Ernie Konnyu 63,130 31.2
American Independent William Pollock Herrell 4,190 2.1
Total votes 202,611 100.0
Turnout  
Democratic hold

1978

1978 United States House of Representatives elections in California
Party Candidate Votes %
Democratic Norm Mineta (Incumbent) 100,809 57.5
Republican Dan O'Keefe 69,306 39.5
Peace and Freedom Robert Goldsborough III 5,246 3.0
Total votes 175,361 100.0
Turnout  
Democratic hold

1980

1980 United States House of Representatives elections in California
Party Candidate Votes %
Democratic Norm Mineta (Incumbent) 132,246 58.9
Republican W. E. "Ted" Gagne 79,766 35.5
Libertarian Ray Strong 8,806 3.9
Peace and Freedom Robert Goldsborough 3,791 1.7
Total votes 224,609 100.0
Turnout  
Democratic hold

1982

1982 United States House of Representatives elections in California
Party Candidate Votes %
Democratic Norm Mineta (Incumbent) 110,805 65.9
Republican Tom Kelly 52,806 31.4
Libertarian Al Hinkle 4,553 2.7
Total votes 168,164 100.0
Turnout  
Democratic hold

1984

1984 United States House of Representatives elections in California
Party Candidate Votes %
Democratic Norm Mineta (Incumbent) 139,851 65.2
Republican John D. "Jack" Williams 70,666 33.0
Libertarian John R. Redding 3,836 1.8
Total votes 214,353 100.0
Turnout  
Democratic hold

1986

1986 United States House of Representatives elections in California
Party Candidate Votes %
Democratic Norm Mineta (Incumbent) 107,696 69.7
Republican Bob Nash 46,754 30.3
Total votes 154,450 100.0
Turnout  
Democratic hold

1988

1988 United States House of Representatives elections in California
Party Candidate Votes %
Democratic Norm Mineta (Incumbent) 143,980 67.1
Republican Luke Somner 63,959 29.8
Libertarian John H. Webster 6,583 3.1
Total votes 214,522 100.0
Turnout  
Democratic hold

1990

1990 United States House of Representatives elections in California
Party Candidate Votes %
Democratic Norm Mineta (Incumbent) 97,286 58.0
Republican David E. Smith 59,773 35.7
Libertarian John H. Webster 10,587 6.3
Total votes 167,646 100.0
Turnout  
Democratic hold

1992

1992 United States House of Representatives elections in California
Party Candidate Votes %
Democratic Pete Stark (Incumbent) 123,795 60.2
Republican Verne W. Teyler 64,953 31.6
Peace and Freedom Roslyn A. Allen 16,768 8.2
Total votes 205,516 100.0
Turnout  
Democratic hold

1994

1994 United States House of Representatives elections in California
Party Candidate Votes %
Democratic Pete Stark (Incumbent) 97,344 64.62
Republican Larry Molton 45,555 30.24
Libertarian Robert "Bob" Gough 7,743 5.14
Total votes 150,642 100.00
Turnout
Democratic hold

1996

1996 United States House of Representatives elections in California
Party Candidate Votes %
Democratic Pete Stark (Incumbent) 114,408 65.2
Republican James Fay 53,385 30.4
Libertarian Terry Savage 7,746 4.4
Total votes 176,539 100.0
Turnout  
Democratic hold

1998

1998 United States House of Representatives elections in California
Party Candidate Votes %
Democratic Pete Stark (Incumbent) 101,671 71.20
Republican James R. Goetz 38,050 26.65
Natural Law Karnig Beylikjian 3,066 4.4
Total votes 142,787 100.0
Turnout  
Democratic hold

2000

2000 United States House of Representatives elections in California
Party Candidate Votes %
Democratic Pete Stark (Incumbent) 129,012 70.5
Republican James R. "Jim" Goetz 44,499 24.3
Libertarian Howard Mora 4,623 2.6
Natural Law Timothy R. Hoehner 2,647 1.4
American Independent Don J. Grundmann 2,365 1.2
Total votes 183,146 100.0
Turnout  
Democratic hold

2002

2002 United States House of Representatives elections in California
Party Candidate Votes %
Democratic Pete Stark (Incumbent) 86,495 71.1
Republican Syed R. Mahmoud 26,852 22.1
Libertarian Mark R. Stroberg 3,703 3.1
American Independent Don J. Grundmann 2,772 2.2
Reform John J. Bambey 1,901 1.5
Total votes 121,723 100.0
Turnout  
Democratic hold

2004

2004 United States House of Representatives elections in California
Party Candidate Votes %
Democratic Pete Stark (Incumbent) 144,605 71.7
Republican George I. Bruno 48,439 28.2
Libertarian Mark R. Stroberg 8,877 4.3
Total votes 201,921 100.0
Turnout  
Democratic hold

2006

2006 United States House of Representatives elections in California
Party Candidate Votes %
Democratic Pete Stark (Incumbent) 144,409 74.9
Republican George I. Bruno 27,141 25.1
Total votes 171,500 100.0
Turnout  
Democratic hold

2008

2008 United States House of Representatives elections in California
Party Candidate Votes %
Democratic Pete Stark (Incumbent) 166,829 76.5
Republican Raymond Chui 51,447 23.5
Total votes 218,276 100.0
Turnout  
Democratic hold

2010

2010 United States House of Representatives elections in California
Party Candidate Votes %
Democratic Pete Stark (Incumbent) 118,278 72.19
Republican Forest Baker 45,545 27.81
Democratic hold

2012

2012 United States House of Representatives elections in California
Party Candidate Votes %
Democratic Barbara Lee (Incumbent) 250,436 87%
No party preference Marilyn M. Singleton 38,146 13%
Total votes 288,582 100.0%
Democratic hold

2014

2014 United States House of Representatives elections in California
Party Candidate Votes %
Democratic Barbara Lee (Incumbent) 168,491 89%
Republican Dakin Sundeen 21,940 11%
Total votes 190,431 100.0%
Democratic hold

2016

2016 United States House of Representatives elections in California
Party Candidate Votes %
Democratic Barbara Lee (Incumbent) 293,117 91%
Republican Sue Caro 29,754 9%
Total votes 322,871 100.0%
Democratic hold

2018

2018 United States House of Representatives elections in California
Party Candidate Votes %
Democratic Barbara Lee (Incumbent) 260,580 88%
Green Laura Wells 34,257 11%
Total votes 294,837 100.0%
Democratic hold

2020

2020 United States House of Representatives elections in California
Party Candidate Votes %
Democratic Barbara Lee (incumbent) 327,863 90.4
Republican Nikka Piterman 34,955 9.6
Total votes 362,818 100.0
Democratic hold

2022

2022 United States House of Representatives elections in California
Party Candidate Votes %
Republican John Duarte 67,060 50.2
Democratic Adam Gray 66,496 49.8
Total votes 133,556 100.0
Republican gain from Democratic

2024

2024 United States House of Representatives elections in California
Party Candidate Votes %
Democratic Adam Gray 105,554 50.0
Republican John Duarte 105,367 50.0
Total votes 210,921 100.0
Democratic gain from Republican

See also

References

  1. "My Congressional District".
  2. "2022 Cook PVI: District Map and List". Cook Political Report. July 12, 2022. Retrieved January 10, 2023.
  3. "CA 2022 Congressional". Dave's Redistricting. January 4, 2022. Retrieved November 11, 2022.
  4. "Maps: Final Congressional Districts". Citizens Redistricting Commission. Archived from the original on March 10, 2013. Retrieved February 25, 2013.
  5. https://davesredistricting.org/maps#viewmap::fc9d2d06-7c7f-451c-92cb-122127a79c29
  6. https://elections.cdn.sos.ca.gov/sov/2022-general/ssov/ssov-complete.pdf
  7. https://results.enr.clarityelections.com/CA/Merced/122862/web.345435/#/summary
  8. https://www.sjgov.org/docs/default-source/registrar-of-voters-documents/current-election-general-2024/statement-of-votes-cast/2024-november---presidential-general-election/2024-general-election-statement-of-votes-cast.pdf?sfvrsn=f2d794b4_10
  9. https://www.stanvote.com/pdf/past-results/11-05-2024-sov.zip
  10. https://www.fresnocountyca.gov/files/sharedassets/county/v/1/county-clerk-registrar-of-voters/1_election-pages/2024_11-nov-general/sovssov/supstatementofvotescastrpt.pdf
  11. https://votemadera.com/wp-content/uploads/2024/12/Madera-County-Certified-Statement-of-the-Vote.pdf
  12. "1932 election results" (PDF).
  13. "1934 election results" (PDF).
  14. "1936 election results" (PDF).
  15. "1938 election results" (PDF).
  16. "1940 election results" (PDF).
  17. "1942 election results" (PDF).
  18. "1944 election results" (PDF).
  19. "1946 election results" (PDF).
  20. "1948 election results" (PDF).
  21. "1950 election results" (PDF).
  22. "1952 election results" (PDF).
  23. "1954 election results" (PDF).
  24. "1956 election results" (PDF).
  25. "1958 election results" (PDF).
  26. "1960 election results" (PDF).
  27. "1962 election results" (PDF).
  28. "1964 election results" (PDF).
  29. "1966 election results" (PDF).
  30. "1968 election results" (PDF).
  31. "1970 election results" (PDF).
  32. "1972 election results" (PDF).
  33. "JoinCalifornia - 03-05-1974 Election". www.joincalifornia.com.
  34. "1974 election results" (PDF).
  35. "1976 election results" (PDF).
  36. "1978 election results" (PDF).
  37. "1980 election results" (PDF).
  38. "1982 election results" (PDF).
  39. "1984 election results" (PDF).
  40. "1986 election results" (PDF).
  41. "1988 election results" (PDF).
  42. "1990 election results" (PDF).
  43. "1992 election results" (PDF).
  44. "1994 election results" (PDF).
  45. "1996 election results" (PDF).
  46. "1998 election results" (PDF).
  47. "2000 election results" (PDF).
  48. "2002 general election results" (PDF). Archived from the original (PDF) on February 3, 2009.
  49. "2004 general election results" (PDF). Archived from the original (PDF) on August 21, 2008.
  50. "2006 general election results" (PDF). Archived from the original (PDF) on November 27, 2008.
  51. "2008 general election results" (PDF). Archived from the original (PDF) on October 18, 2012. Retrieved January 5, 2009.
  52. "2010 general election results" (PDF). Archived from the original (PDF) on June 11, 2014. Retrieved March 24, 2011.
  53. ^ "2012 general election results" (PDF). Archived from the original (PDF) on October 19, 2013.

External links

California's congressional districts
All districts
At-large
1st
2nd
3rd
4th
5th
6th
7th
8th
9th
10th
11th
12th
13th
14th
15th
16th
17th
18th
19th
20th
21st
22nd
23rd
24th
25th
26th
27th
28th
29th
30th
31st
32nd
33rd
34th
35th
36th
37th
38th
39th
40th
41st
42nd
43rd
44th
45th
46th
47th
48th
49th
50th
51st
52nd
53rd
  • The at-large seats only existed from 1850 to 1865 and from 1883 to 1885.
    The 53rd district is obsolete.
See also
California's past and present representatives, senators, and delegations
Categories:
California's 13th congressional district Add topic