| ||||||||||||||||||||||||||||||||||||||||||||||||||||||||||||||||||||||||||||||||||||||||||
| 1937 (AR) → | ||||||||||||||||||||||||||||||||||||||||||||||||||||||||||||||||||||||||||||||||||||||||||
32 of the 96 seats in the United States Senate 49 seats needed for a majority | ||||||||||||||||||||||||||||||||||||||||||||||||||||||||||||||||||||||||||||||||||||||||||
|---|---|---|---|---|---|---|---|---|---|---|---|---|---|---|---|---|---|---|---|---|---|---|---|---|---|---|---|---|---|---|---|---|---|---|---|---|---|---|---|---|---|---|---|---|---|---|---|---|---|---|---|---|---|---|---|---|---|---|---|---|---|---|---|---|---|---|---|---|---|---|---|---|---|---|---|---|---|---|---|---|---|---|---|---|---|---|---|---|---|---|
| ||||||||||||||||||||||||||||||||||||||||||||||||||||||||||||||||||||||||||||||||||||||||||
 Democratic gain Democratic hold Republican gain Republican hold Farmer–Labor hold Independent gain No election | ||||||||||||||||||||||||||||||||||||||||||||||||||||||||||||||||||||||||||||||||||||||||||
| ||||||||||||||||||||||||||||||||||||||||||||||||||||||||||||||||||||||||||||||||||||||||||
The 1936 United States Senate elections coincided with the reelection of President Franklin D. Roosevelt. The 32 seats of Class 2 were contested in regular elections, and special elections were held to fill vacancies. The Great Depression continued and voters backed progressive candidates favoring Roosevelt's New Deal in races across the country. The Democrats gained 5 net seats during the election, and in combination with Democratic and Farmer–Labor interim appointments and the defection of George W. Norris from the Republican Party to become independent, the Republicans were reduced to 16 seats. Democrats gained a further two seats due to mid-term vacancies. The Democrats' 77 seats and their 62-seat majority remain their largest in history.
This was the last of four consecutive election cycles where Republicans suffered losses due to the ongoing effects of the Great Depression. This was also the last Senate election cycle until 2012 in which a Democratic candidate who won two terms also made net gains in the Senate on both occasions (although Roosevelt won a third term and fourth term, he lost Senate seats on both occasions). Additionally, this is the last time any party held three-fourths of all Senate seats.
Gains, losses, and holds
Retirements
One Republican, one Farmer-Labor, and five Democrats retired instead of seeking re-election.
Defeats
Six Republicans and one Democrat sought re-election but lost in the primary or general election.
Death
One Democrat died on July 16, 1936, and his seat remained vacant until the election.
| State | Senator | Replaced by |
|---|---|---|
| Iowa (special) | Louis Murphy | Guy Gillette |
Independent gain
One Republican won re-election as an Independent.
| State | Senator | Replaced by |
|---|---|---|
| Nebraska | George W. Norris | George W. Norris |
Post-election changes
Change in composition
Before the elections
After the April 1936 special election.
| D1 | D2 | D3 | D4 | D5 | D6 | D7 | D8 | ||
| D18 | D17 | D16 | D15 | D14 | D13 | D12 | D11 | D10 | D9 |
| D19 | D20 | D21 | D22 | D23 | D24 | D25 | D26 | D27 | D28 |
| D38 | D37 | D36 | D35 | D34 | D33 | D32 | D31 | D30 | D29 |
| D39 | D40 | D41 | D42 | D43 | D44 | D45 | D46 | D47 | D48 Ala. Ran |
| Majority → | D49 Ark. Ran | ||||||||
| D58 Miss. Ran |
D57 Mass. Retired |
D56 La. (sp) Elected La. (reg) Retired |
D55 Ky. Ran |
D54 Ill. Ran |
D53 Ga. Ran |
D52 Fla. (sp3) Retired |
D51 Fla. (sp1) Retired |
D50 Colo. Retired | |
| D59 Mont. Ran |
D60 N.M. (reg) Ran |
D61 N.M. (sp) Ran |
D62 N.C. Ran |
D63 Okla. Ran |
D64 S.C. Ran |
D65 S.D. Ran |
D66 Tenn. Ran |
D67 Texas Ran |
D68 Va. Ran |
| R19 N.H. Retired |
R20 N.J. Ran |
R21 Ore. Ran |
R22 R.I. Ran |
R23 Wyo. Ran |
FL1 | FL2 Minn. (sp) Minn. (reg) Retired |
P1 | V1 Iowa (sp) |
D69 W.Va. Ran |
| R18 Neb. Ran |
R17 Mich. Ran |
R16 Maine Ran |
R15 Kan. Ran |
R14 Iowa Ran |
R13 Idaho Ran |
R12 Del. Ran |
R11 | R10 | R9 |
| R1 | R2 | R3 | R4 | R5 | R6 | R7 | R8 | ||
Result of the elections
| D1 | D2 | D3 | D4 | D5 | D6 | D7 | D8 | |||
| D18 | D17 | D16 | D15 | D14 | D13 | D12 | D11 | D10 | D9 | |
| D19 | D20 | D21 | D22 | D23 | D24 | D25 | D26 | D27 | D28 | |
| D38 | D37 | D36 | D35 | D34 | D33 | D32 | D31 | D30 | D29 | |
| D39 | D40 | D41 | D42 | D43 | D44 | D45 | D46 | D47 | D48 Ala. Re-elected | |
| Majority → | D49 Ark. Re-elected | |||||||||
| D58 Mont. Re-elected |
D57 Miss. Re-elected |
D56 La. (reg) Hold |
D55 Ky. Re-elected |
D54 Ill. Re-elected |
D53 Ga. Re-elected |
D52 Fla. (sp3) Hold |
D51 Fla. (sp1) Hold |
D50 Colo. Hold | ||
| D59 N.M. (reg) Re-elected |
D60 N.M. (sp) Elected |
D61 N.C. Re-elected |
D62 Okla. Hold |
D63 S.C. Re-elected |
D64 S.D. Re-elected |
D65 Tenn. Re-elected |
D66 Texas Re-elected |
D67 Va. Re-elected |
D68 W.Va. Re-elected | |
| FL1 | FL2
Hold |
P1 | D75 Wyo. Gain |
D74 R.I. Gain |
D73 N.J. Gain |
D72 Mich. Gain |
D71 Iowa (sp) Hold |
D70 Iowa (reg) Gain |
D69 Del. Gain | |
| I1 Neb. Re-elected new party |
R17 Mass. Gain |
R16 Ore. Re-elected |
R15 N.H. Hold |
R14 Maine Re-elected |
R13 Kan. Re-elected |
R12 Idaho Re-elected |
R11 | R10 | R9 | |
| R1 | R2 | R3 | R4 | R5 | R6 | R7 | R8 | |||
Beginning of the next Congress
| D1 | D2 | D3 | D4 | D5 | D6 | D7 | D8 | ||
| D18 | D17 | D16 | D15 | D14 | D13 | D12 | D11 | D10 | D9 |
| D19 | D20 | D21 | D22 | D23 | D24 | D25 | D26 | D27 | D28 |
| D38 | D37 | D36 | D35 | D34 | D33 | D32 | D31 | D30 | D29 |
| D39 | D40 | D41 | D42 | D43 | D44 | D45 | D46 | D47 | D48 |
| Majority → | D49 | ||||||||
| D58 | D57 | D56 | D55 | D54 | D53 | D52 | D51 | D50 | |
| D59 | D60 | D61 | D62 | D63 | D64 | D65 | D66 | D67 | D68 |
| FL2 | P1 | D76 S.D. Appointed |
D75 | D74 | D73 | D72 | D71 | D70 | D69 |
| FL1 | I1 | R16 | R15 | R14 | R13 | R12 | R11 | R10 | R9 |
| R1 | R2 | R3 | R4 | R5 | R6 | R7 | R8 | ||
| Key |
|
|---|

Race summaries
Elections during the 74th Congress
In these special elections the winners were seated once they qualified; ordered by election date.
| State | Incumbent | Results | Candidates | ||
|---|---|---|---|---|---|
| Senator | Party | Electoral history | |||
| Louisiana (Class 2) |
Rose McConnell Long | Democratic | 1936 (Appointed) | Interim appointee elected April 21, 1936. Winner was later not elected to the next term; see below. |
|
| Florida (Class 1) |
Scott Loftin | Democratic | 1936 (Appointed) | Interim appointee retired. New senator elected November 3, 1936. Democratic hold. |
|
| Florida (Class 3) |
William Luther Hill | Democratic | 1936 (Appointed) | Interim appointee retired. New senator elected November 3, 1936. Democratic hold. |
|
| Iowa (Class 3) |
Vacant | Louis Murphy (D) had died July 16, 1936. New senator elected November 3, 1936. Democratic hold |
| ||
| Minnesota (Class 2) |
Elmer A. Benson | Farmer–Labor | 1935 (Appointed) | Interim appointee retired. New senator elected November 3, 1936. Republican gain. Winner was not a candidate for the next term; see below. |
|
| New Mexico (Class 1) |
Dennis Chávez | Democratic | 1935 (Appointed) | Interim appointee elected November 3, 1936. |
|
Elections leading to the 75th Congress
In these general elections, the winners were elected for the term beginning January 3, 1937; ordered by state.
All of the elections involved the Class 2 seats.
| State | Incumbent | Results | Candidates | ||
|---|---|---|---|---|---|
| Senator | Party | Electoral history | |||
| Alabama | John H. Bankhead II | Democratic | 1930 | Incumbent re-elected. |
|
| Arkansas | Joseph T. Robinson | Democratic | 1913 1918 1924 1930 |
Incumbent re-elected. |
|
| Colorado | Edward P. Costigan | Democratic | 1930 | Incumbent retired. New senator elected. Democratic hold. |
|
| Delaware | Daniel O. Hastings | Republican | 1928 (Appointed) 1930 |
Incumbent lost re-election. New senator elected. Democratic gain. |
|
| Georgia | Richard Russell Jr. | Democratic | 1932 (special) | Incumbent re-elected. |
|
| Idaho | William Borah | Republican | 1907 1913 1918 1924 1930 |
Incumbent re-elected. |
|
| Illinois | J. Hamilton Lewis | Democratic | 1913 (Late) 1918 (Lost) 1930 |
Incumbent re-elected. |
|
| Iowa | L. J. Dickinson | Republican | 1930 | Incumbent lost re-election. New senator elected. Democratic gain. |
|
| Kansas | Arthur Capper | Republican | 1918 1924 1930 |
Incumbent re-elected. |
|
| Kentucky | M. M. Logan | Democratic | 1930 | Incumbent re-elected. |
|
| Louisiana | Rose McConnell Long | Democratic | 1936 (Appointed) 1936 (special) |
Incumbent retired. New senator elected. Democratic hold. |
|
| Maine | Wallace H. White | Republican | 1930 | Incumbent re-elected. |
|
| Massachusetts | Marcus A. Coolidge | Democratic | 1930 | Incumbent retired. New senator elected. Republican gain. |
|
| Michigan | James Couzens | Republican | 1922 (Appointed) 1924 (special) 1924 1930 |
Incumbent lost renomination then died October 22, 1936. New senator elected. Democratic gain. Winner was later appointed to finish term. |
|
| Minnesota | Elmer A. Benson | Farmer–Labor | 1935 (Appointed) | Interim appointee retired to run for Governor of Minnesota. New senator elected. Farmer–Labor hold. Winner was not a candidate to finish the current term. |
|
| Mississippi | Pat Harrison | Democratic | 1918 1924 1930 |
Incumbent re-elected. |
|
| Montana | James E. Murray | Democratic | 1934 (special) | Incumbent re-elected. |
|
| Nebraska | George W. Norris | Republican | 1913 1918 1924 1930 |
Incumbent re-elected as an Independent. Independent gain. |
|
| New Hampshire | Henry W. Keyes | Republican | 1918 1924 1930 |
Incumbent retired. New senator elected. Republican hold. |
|
| New Jersey | W. Warren Barbour | Republican | 1931 (Appointed) 1932 (special) |
Incumbent lost re-election. New senator elected. Democratic gain. |
|
| New Mexico | Carl Hatch | Democratic | 1933 (Appointed) 1934 (special) |
Incumbent re-elected. |
|
| North Carolina | Josiah Bailey | Democratic | 1930 | Incumbent re-elected. |
|
| Oklahoma | Thomas Gore | Democratic | 1907 (New state) 1909 1914 1920 (Lost) 1930 |
Incumbent lost renomination. New senator elected. Democratic hold. |
|
| Oregon | Charles L. McNary | Republican | 1917 (Appointed) 1918 (Not elected 1918 (Appointed) 1918 1924 1930 |
Incumbent re-elected. |
|
| Rhode Island | Jesse H. Metcalf | Republican | 1924 (special) 1924 1930 |
Incumbent lost re-election. New senator elected. Democratic gain. |
|
| South Carolina | James F. Byrnes | Democratic | 1930 | Incumbent re-elected. |
|
| South Dakota | William J. Bulow | Democratic | 1930 | Incumbent re-elected. |
|
| Tennessee | Nathan L. Bachman | Democratic | 1933 (Appointed) 1934 (special) |
Incumbent re-elected. |
|
| Texas | Morris Sheppard | Democratic | 1913 (special) 1913 1918 1924 1930 |
Incumbent re-elected. |
|
| Virginia | Carter Glass | Democratic | 1920 (Appointed) 1920 (special) 1924 1930 |
Incumbent re-elected. |
|
| West Virginia | Matthew M. Neely | Democratic | 1930 | Incumbent re-elected. |
|
| Wyoming | Robert D. Carey | Republican | 1930 (special) 1930 |
Incumbent lost re-election. New senator elected. Democratic gain. |
|
Closest races
Eleven races had a margin of victory under 10%:
| State | Party of winner | Margin |
|---|---|---|
| Maine | Republican | 1.5% |
| Kansas | Republican | 2.6% |
| Oregon | Republican | 2.6% |
| South Dakota | Democratic | 2.0% |
| Iowa | Democratic (flip) | 3.4% |
| New Hampshire | Republican | 4.2% |
| Rhode Island | Democratic (flip) | 4.2% |
| Iowa (special) | Democratic (flip) | 5.3% |
| Nebraska | Independent (flip) | 6.0% |
| Massachusetts | Republican (flip) | 7.5% |
| Wyoming | Democratic (flip) | 8.4% |
There is no tipping point state.
Alabama
| |||||||||||||||||
| |||||||||||||||||
 County results County resultsBankhead: 50–60% 60–70% 70–80% 80–90% >90% Berkstresser: 50–60% | |||||||||||||||||
| |||||||||||||||||
| Party | Candidate | Votes | % | |
|---|---|---|---|---|
| Democratic | John H. Bankhead II (Incumbent) | 239,532 | 87.02% | |
| Republican | H. E. Berkstresser | 33,697 | 12.24% | |
| Independent | William C. Irby | 2,022 | 0.73% | |
| Independent | Sam Powe | 1 | 0.00% | |
| Majority | 105,835 | 74.78% | ||
| Turnout | 275,252 | |||
| Democratic hold | ||||
Arkansas
Main article: 1936 United States Senate election in Arkansas See also: List of United States senators from Arkansas
| |||||||||||||||||
| |||||||||||||||||
 County results County resultsRobinson: 50–60% 60–70% 70–80% 80–90% >90% Ledbetter: 50–60% Williams: 50–60% Tie: 40-50% | |||||||||||||||||
| |||||||||||||||||
| Party | Candidate | Votes | % | |
|---|---|---|---|---|
| Democratic | Joseph Taylor Robinson | 154,866 | 84.08% | |
| Republican | G. C. Ledbetter | 27,746 | 15.06% | |
| Independent | Claude C. Williams | 1,587 | 0.86% | |
| Majority | 127,120 | 69.02% | ||
| Turnout | 184,199 | |||
| Democratic hold | ||||
Colorado
| |||||||||||||||||
| |||||||||||||||||
 Results by county Results by county Johnson: 50–60% 60–70% 70–80% Sauter: 50–60% | |||||||||||||||||
| |||||||||||||||||
| Party | Candidate | Votes | % | |
|---|---|---|---|---|
| Democratic | Edwin C. Johnson | 299,376 | 63.45% | |
| Republican | Raymond L. Sauter | 166,308 | 35.25% | |
| Socialist | Carle Whithead | 4,438 | 0.94% | |
| National Union | George W. Carleton | 1,705 | 0.36% | |
| Majority | 133,068 | 28.20% | ||
| Turnout | 471,827 | |||
| Democratic hold | ||||
Delaware
See also: List of United States senators from Delaware| Party | Candidate | Votes | % | |
|---|---|---|---|---|
| Democratic | James H. Hughes | 67,136 | 52.97% | |
| Republican | Daniel O. Hastings (Incumbent) | 52,469 | 41.40% | |
| Independent | Robert G. Houston | 6,897 | 5.44% | |
| Socialist | Charles W. Perry | 183 | 0.14% | |
| Communist | William V. P. Daviatis | 53 | 0.04% | |
| Majority | 14,667 | 11.57% | ||
| Turnout | 126,738 | |||
| Democratic gain from Republican | ||||
Florida (special)
See also: List of United States senators from FloridaThere were two special elections in Florida, due to the May 8, 1936, death of four-term Democrat Park Trammell and the June 17, 1936, death of five-term Democrat Duncan U. Fletcher.
Florida (special, class 1)
| |||||||||||||||||
| |||||||||||||||||
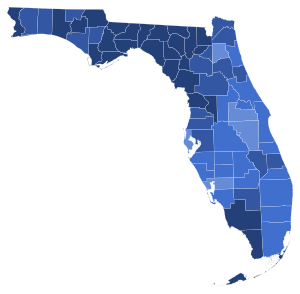 Results by county Results by countyAndrews: 60–70% 70–80% 80–90% >90% | |||||||||||||||||
| |||||||||||||||||
Democrat Scott M. Loftin was appointed May 26, 1936, to continue the term, pending a special election. Primaries were held August 11, 1936.
| Party | Candidate | Votes | % | ||
|---|---|---|---|---|---|
| Democratic | Charles O. Andrews | 241,528 | 81.90% | ||
| Republican | Howard C. Babcock | 57,016 | 19.10% | ||
| Majority | 184,512 | 62.80% | |||
| Turnout | 298,544 | 20.33% | |||
| Democratic hold | |||||
Andrews would be re-elected once and serve until his death September 18, 1946.
Florida (special, class 3)
Democrat William Luther Hill was appointed July 1, 1936, to continue the term, pending a special election. Democrat Claude Pepper, who had lost to Trammell in 1934 won this election.
| Party | Candidate | Votes | % | ||
|---|---|---|---|---|---|
| Democratic | Claude Pepper | 246,050 | 100.00% | ||
| Turnout | 16.76% | ||||
| Democratic hold | |||||
Pepper would be re-elected twice and serve until he lost renomination in 1950. He would later be elected to the U.S. House of Representatives and serve there for 26 years.
Georgia
Main article: 1936 United States Senate election in Georgia| Democratic primary | |||
|---|---|---|---|
| Candidate | Votes | % | CUV |
| Richard Russell Jr. | 165,111 | 65.54 | 344 |
| Eugene Talmadge | 86,203 | 34.46 | 66 |
| Party | Candidate | Votes | % | |
|---|---|---|---|---|
| Democratic | Richard Russell Jr. (Incumbent) | 285,468 | 100.00% | |
| Democratic hold | ||||
Idaho
| |||||||||||||||||
| |||||||||||||||||
 County results County resultsBorah: 50-60% 60-70% 70-80% Ross: 50–60% | |||||||||||||||||
| |||||||||||||||||
| Party | Candidate | Votes | % | |
|---|---|---|---|---|
| Republican | William Borah (Incumbent) | 128,723 | 63.36% | |
| Democratic | C. Ben Ross | 74,444 | 36.64% | |
| Majority | 54,279 | 26.72% | ||
| Turnout | 203,167 | |||
| Republican hold | ||||
Illinois
Main article: 1936 United States Senate election in Illinois See also: List of United States senators from Illinois
| |||||||||||||||||
| |||||||||||||||||
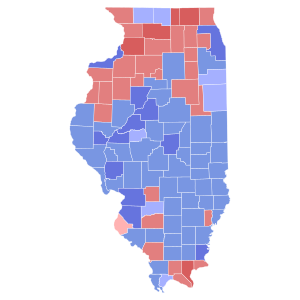 Results by county Results by countyLewis: 40–50% 50–60% 60–70% Glenn: 40–50% 50–60% 60–70% | |||||||||||||||||
| |||||||||||||||||
| Party | Candidate | Votes | % | |
|---|---|---|---|---|
| Democratic | J. Hamilton Lewis (Incumbent) | 2,142,887 | 56.47% | |
| Republican | Otis F. Glenn | 1,545,170 | 40.72% | |
| Union | Newton Jenkins | 93,696 | 2.47% | |
| Socialist | Arthur McDowell | 7,405 | 0.20% | |
| Prohibition | Adah M. Hagler | 3,298 | 0.09% | |
| Socialist Labor | Frank Schnur | 2,208 | 0.06% | |
| Majority | 597,717 | 15.75% | ||
| Turnout | 3,794,664 | |||
| Democratic hold | ||||
Iowa
See also: List of United States senators from IowaIowa (regular)
Main article: 1936 United States Senate election in Iowa
| |||||||||||||||||
| |||||||||||||||||
 County Results County ResultsHerring: 40–50% 50–60% 60–70% Dickinson: 40–50% 50–60% 60–70% | |||||||||||||||||
| |||||||||||||||||
| Party | Candidate | Votes | % | |
|---|---|---|---|---|
| Democratic | Clyde L. Herring | 539,555 | 50.34% | |
| Republican | Lester J. Dickinson (Incumbent) | 503,635 | 46.99% | |
| Farmer–Labor | George F. Buresch | 25,567 | 2.39% | |
| Prohibition | John B. Hammond | 1,726 | 0.16% | |
| Socialist | Laetitia M. Conrad | 1,233 | 0.12% | |
| Majority | 35,920 | 3.35% | ||
| Turnout | 1,071,716 | |||
| Democratic gain from Republican | ||||
Iowa (special)
Main article: 1936 United States Senate special election in Iowa
| |||||||||||||||||||
| |||||||||||||||||||
 County Results County ResultsGillette: 40–50% 50–60% 60–70% Halden: 40–50% 50–60% 60–70% | |||||||||||||||||||
| |||||||||||||||||||
| Party | Candidate | Votes | % | |
|---|---|---|---|---|
| Democratic | Guy M. Gillette | 535,966 | 52.00% | |
| Republican | Berry.F. Halden | 478,516 | 46.43% | |
| Farmer–Labor | Ernest R. Quick | 16,179 | 1.57% | |
| Majority | 57,450 | 5.57% | ||
| Turnout | 1,030,661 | |||
| Democratic hold | ||||
Kansas
| |||||||||||||||||
| |||||||||||||||||
 County results County resultsCapper: 40–50% 50–60% 60–70% Ketchum: 40–50% 50–60% 60–70% | |||||||||||||||||
| |||||||||||||||||
| Party | Candidate | Votes | % | |
|---|---|---|---|---|
| Republican | Arthur Capper (Incumbent) | 417,873 | 51.63% | |
| Democratic | Omar B. Ketchum | 386,685 | 47.78% | |
| Socialist | T. C. Hager | 4,775 | 0.59% | |
| Majority | 31,188 | 3.85% | ||
| Turnout | 809,333 | |||
| Republican hold | ||||
Kentucky
| |||||||||||||||||
| |||||||||||||||||
 County results County resultsLogan: 50–60% 60–70% 70–80% 80–90% Lucas: 50–60% 60–70% 70–80% 80–90% | |||||||||||||||||
| |||||||||||||||||
| Party | Candidate | Votes | % | |
|---|---|---|---|---|
| Democratic | M. M. Logan (Incumbent) | 539,968 | 58.80% | |
| Republican | Robert H. Lucas | 365,850 | 39.84% | |
| Union | William M. Likins | 11,709 | 1.28% | |
| Socialist | W. E. Sandefer | 541 | 0.06% | |
| Socialist Labor | Ferdinand Zimmerer | 271 | 0.03% | |
| Majority | 174,118 | 18.96% | ||
| Turnout | 918,339 | |||
| Democratic hold | ||||
Louisiana
See also: List of United States senators from LouisianaLouisiana (regular)
| Party | Candidate | Votes | % | |
|---|---|---|---|---|
| Democratic | Allen J. Ellender | 293,256 | 100.00% | |
| None | Scattering | 7 | 0.00% | |
| Majority | 293,249 | 100.00% | ||
| Turnout | 293,263 | |||
| Democratic hold | ||||
Louisiana (special)
Main article: 1936 United States Senate special election in LouisianaDemocrat Rose McConnell Long was elected April 21, 1936, to finish the term to which she was appointed on January 31, 1936. She was not a candidate, however, to the next term on November 3, 1936, see above.
| This section needs expansion. You can help by adding to it. (January 2020) |
| |||||||||||||||||
| |||||||||||||||||
 Parish results Parish resultsLong 90–100% | |||||||||||||||||
| |||||||||||||||||
Maine
| |||||||||||||||||
| |||||||||||||||||
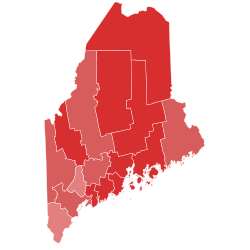 County Results County Results White: 50–60% 60–70% 70–80% | |||||||||||||||||
| |||||||||||||||||
| Party | Candidate | Votes | % | |
|---|---|---|---|---|
| Republican | Wallace H. White Jr. (Incumbent) | 158,068 | 50.75% | |
| Democratic | Louis J. Brann | 153,420 | 49.25% | |
| Majority | 4,648 | 1.50% | ||
| Turnout | 311,488 | |||
| Republican hold | ||||
Massachusetts
| |||||||||||||||||||||
| |||||||||||||||||||||
 County results
 Municipality resultsLodge: 40–50% 50–60% 60–70% 70–80% 80–90% 90–100%
Curley: 40–50% 50–60% 60–70% 70–80% | |||||||||||||||||||||
| |||||||||||||||||||||
| Party | Candidate | Votes | % | ±% | |
|---|---|---|---|---|---|
| Republican | Henry Cabot Lodge Jr. | 875,160 | 48.53 | +3.86 | |
| Democratic | James Michael Curley | 739,751 | 41.02 | −12.99 | |
| Union | Thomas C. O'Brien | 134,245 | 7.44 | +7.44 | |
| Economy | Alonzo B. Cook | 11,519 | 0.64 | +0.64 | |
| Social Justice | Guy M. Gray | 9,906 | 0.55 | +0.55 | |
| Socialist | Albert Sprague Coolidge | 9,763 | 0.54 | −0.06 | |
| Townsend | Moses H. Gulesian | 7,408 | 0.41 | +0.41 | |
| Socialist Labor | Ernest L. Dodge | 7,408 | 0.39 | +0.01 | |
| Communist | Charles Flaherty | 4,821 | 0.27 | −0.06 | |
| Prohibition | Wilbur D. Moon | 3,677 | 0.20 | +0.20 | |
| Write-in | 16 | 0.00 | |||
| total | 1,803,674 | 100.00 | |||
Michigan
| |||||||||||||||||
| |||||||||||||||||
 County results County resultsBrown: 40–50% 50–60% 60–70% Brucker: 40–50% 50–60% 60–70% 70–80% | |||||||||||||||||
| |||||||||||||||||
| Party | Candidate | Votes | % | |
|---|---|---|---|---|
| Democratic | Prentiss M. Brown | 910,937 | 53.29% | |
| Republican | Wilber M. Brucker | 714,602 | 41.80% | |
| The Third Party | Louis B. Ward | 75,680 | 4.43% | |
| Socialist | Roy E. Mathews | 4,994 | 0.29% | |
| Communist | Lawrence Emery | 2,145 | 0.13% | |
| Socialist Labor | Ralph Naylor | 510 | 0.03% | |
| Commonwealth Land | Albert B. Sheldon | 429 | 0.03% | |
| American | Edward N. Lee | 147 | 0.01% | |
| Majority | 196,335 | 11.49% | ||
| Turnout | 1,709,444 | |||
| Democratic gain from Republican | ||||
Minnesota
See also: List of United States senators from Minnesota and 1936 United States House of Representatives elections in MinnesotaThere were 2 elections to the same seat on the same day due to the December 22, 1935, death of two-term Republican Thomas D. Schall.
Minnesota (special)
| |||||||||||||||||||||||||||||||||||||
| |||||||||||||||||||||||||||||||||||||
 County Results: County Results:Howard: 30-40% 40-50% 50-60% 60-70% Holmberg: 30-40% Devold: 30-40% Tie: Howard/Holmberg 30-40% | |||||||||||||||||||||||||||||||||||||
| |||||||||||||||||||||||||||||||||||||
The election was held to fill the vacancy in the seat formerly held by Thomas D. Schall for the final two months of Schall's unexpired term. Governor Floyd B. Olson had appointed Elmer Benson to fill the seat in 1935, but this appointment was temporary and subject to a special election held in the next general election year thereafter—1936. Benson opted to run for governor instead of running for election to continue for the remainder of the term. No special primaries were held for the special election, and, among Minnesota's three major parties, only the Republican Party of Minnesota officially fielded a candidate—Guy V. Howard. Regardless of the absence of Farmer-Labor and Democratic nominees, Howard nevertheless faced a great degree of competition from independent candidates Nathaniel J. Holmberg, Andrew Olaf Devold, and John G. Alexander.
The candidates were:
- John G. Alexander (I), Attorney and real estate manager
- Andrew Olaf Devold (I), Attorney, State Senator since 1919, former State Representative (1915–1919); a member of the Farmer-Labor Party of Minnesota and formerly a member of the Socialist Party of Minnesota
- N. J. Holmberg (I), Former State Senator (1915–1919) and State Representative (1907–1915); a member of the Republican Party of Minnesota
- Guy V. Howard (R), Businessman and Republican elector in the 1916 presidential election
| Party | Candidate | Votes | % | |
|---|---|---|---|---|
| Republican | Guy V. Howard | 317,457 | 42.89% | |
| Independent | N. J. Holmberg | 210,364 | 28.42% | |
| Independent | Andrew Olaf Devold | 147,858 | 19.98% | |
| Independent | John G. Alexander | 64,493 | 8.71% | |
| Total votes | 740,172 | 100.00% | ||
| Majority | 107,093 | 14.47% | ||
| Republican gain from Farmer–Labor | ||||
Howard was not a candidate for the next term, and served only until January 1937.
Minnesota (regular)
| |||||||||||||||||
| |||||||||||||||||
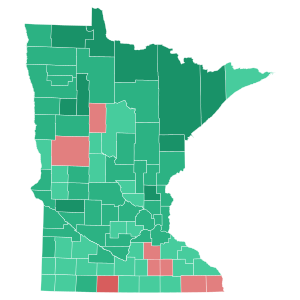 County results County resultsLundeen: 50–60% 60–70% 70–80% Christianson: 50–60% 60–70% | |||||||||||||||||
| |||||||||||||||||
The election to the next term was won by Farmer–Labor congressman Ernest Lundeen.
| Party | Candidate | Votes | % | |
|---|---|---|---|---|
| Farmer–Labor | Ernest Lundeen | 663,363 | 62.24% | |
| Republican | Theodore Christianson | 402,404 | 37.76% | |
| Majority | 260,959 | 24.48% | ||
| Turnout | 1,065,767 | |||
| Farmer–Labor hold | ||||
Mississippi
| |||||||||||||||||
| |||||||||||||||||
 County results County resultsHarrison: 40-50% 50-60% 60-70% 70-80% 80-90% Conner: 40-50% 50-60% 60-70% | |||||||||||||||||
| |||||||||||||||||
| Party | Candidate | Votes | % | |
|---|---|---|---|---|
| Democratic | Pat Harrison (Incumbent) | 140,570 | 100.00% | |
| Democratic | Mike Conner | 1 | 0.00% | |
| Democratic | Frank Harper | 1 | 0.00% | |
| Majority | 140,569 | 100.00% | ||
| Turnout | 140,572 | |||
| Democratic hold | ||||
Montana
| |||||||||||||||||||||
| |||||||||||||||||||||
 County results County resultsMurray: 40-50% 50–60% 60–70% 70–80% Monaghan: 40–50% No Data/Vote: Tie: 40-50 | |||||||||||||||||||||
| |||||||||||||||||||||
| Party | Candidate | Votes | % | ±% | |
|---|---|---|---|---|---|
| Democratic | James E. Murray (Incumbent) | 121,769 | 54.98% | −4.68% | |
| Republican | Thomas O. Larson | 60,038 | 27.11% | −12.32% | |
| Independent | Joseph P. Monaghan | 39,655 | 17.91% | ||
| Majority | 61,731 | 27.87% | +7.65% | ||
| Turnout | 221,462 | ||||
| Democratic hold | Swing | ||||
Nebraska
| |||||||||||||||||||||
| |||||||||||||||||||||
 Results by county Results by county
| |||||||||||||||||||||
| |||||||||||||||||||||
| Party | Candidate | Votes | % | |
|---|---|---|---|---|
| Independent | George W. Norris (Incumbent) | 258,700 | 43.82% | |
| Republican | Robert G. Simmons | 223,276 | 37.82% | |
| Democratic | Terry Carpenter | 108,391 | 18.36% | |
| Majority | 35,424 | 6.00% | ||
| Turnout | 590,367 | |||
| Independent gain from Republican | ||||
New Hampshire
| |||||||||||||||||
| |||||||||||||||||
 County results County resultsBridges: 50–60% 60–70% Rogers: 50–60% | |||||||||||||||||
| |||||||||||||||||
| Party | Candidate | Votes | % | |
|---|---|---|---|---|
| Republican | Styles Bridges | 107,923 | 51.86% | |
| Democratic | William Nathaniel Rogers | 99,195 | 47.67% | |
| Farmer–Labor | Stearns Morse | 989 | 0.48% | |
| Majority | 8,728 | 4.19% | ||
| Turnout | 208,107 | |||
| Republican hold | ||||
New Jersey
| ← 1932 (special)1942 → | |||||||||||||||||
| |||||||||||||||||
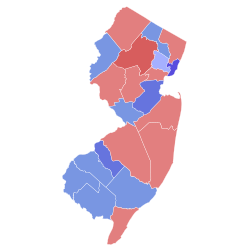 County Results County ResultsSmathers: 40–50% 50–60% 60–70% 70–80% Barbour: 50-60% 60-70% | |||||||||||||||||
| |||||||||||||||||
| Party | Candidate | Votes | % | |
|---|---|---|---|---|
| Democratic | William H. Smathers | 916,414 | 54.90% | |
| Republican | William Warren Barbour (Incumbent) | 740,088 | 44.34% | |
| Townsend | Fred Turner | 6,651 | 0.40% | |
| Socialist | Herman F. Niessner | 3,309 | 0.20% | |
| Communist | Herbert Coley | 1,414 | 0.08% | |
| Prohibition | Malcolm G. Thomas | 967 | 0.06% | |
| Socialist Labor | George E. Bopp | 448 | 0.03% | |
| Majority | 176,326 | 10.56% | ||
| Turnout | 1,669,291 | |||
| Democratic gain from Republican | ||||
New Mexico
See also: List of United States senators from New Mexico and 1936 United States House of Representatives election in New MexicoThere were 2 elections, due to the May 6, 1935, death of two-term Republican Bronson M. Cutting.
New Mexico (special)
| |||||||||||||||||
| |||||||||||||||||
 County results County resultsChávez: 50–60% 60–70% 70–80% 80–90% Otero: 50–60% | |||||||||||||||||
| |||||||||||||||||
Democratic former-Congressman Dennis Chavez had been Cutting's opponent in 1934. On May 11, 1935, after Cutting's death, Chavez was then appointed to continue Cutting's term, pending a special election which he then won.
| Party | Candidate | Votes | % | |
|---|---|---|---|---|
| Democratic | Dennis Chávez (Incumbent) | 94,585 | 55.74% | |
| Republican | M. A. Otero Jr. | 75,029 | 44.22% | |
| Farmer–Labor | Santiago El Mayor Matta | 68 | 0.04% | |
| Majority | 19,556 | 11.52% | ||
| Turnout | 169,438 | |||
| Democratic hold | ||||
Chavez would be re-elected four more times and serve until his death in 1962.
New Mexico (regular)
| |||||||||||||||||
| |||||||||||||||||
 County results County resultsHatch: 50–60% 60–70% 70–80% 80–90% Everly: 50–60% | |||||||||||||||||
| |||||||||||||||||
First-term Democrat Carl Hatch was easily re-elected.
| Party | Candidate | Votes | % | |
|---|---|---|---|---|
| Democratic | Carl Hatch (Incumbent) | 104,550 | 61.70% | |
| Republican | Ernest W. Everly | 64,817 | 38.25% | |
| Farmer–Labor | W. C. Throp | 71 | 0.04% | |
| Majority | 39,733 | 23.45% | ||
| Turnout | 169,682 | |||
| Democratic hold | ||||
Hatch would be re-elected once and serve until his 1948 retirement.
North Carolina
| |||||||||||||||||
| |||||||||||||||||
 County results County resultsBailey: 50–60% 60–70% 70–80% 80–90% 90-100% Patton: 50–60% 60–70% 70–80% | |||||||||||||||||
| |||||||||||||||||
| Party | Candidate | Votes | % | |
|---|---|---|---|---|
| Democratic | Josiah Bailey (Incumbent) | 563,968 | 70.76% | |
| Republican | Frank C. Patton | 233,009 | 29.24% | |
| Majority | 330,959 | 41.52% | ||
| Turnout | 796,977 | |||
| Democratic hold | ||||
Oklahoma
| |||||||||||||||||
| |||||||||||||||||
 County results County resultsLee: 50–60% 60–70% 70–80% 80–90% Hyde: 50–60% | |||||||||||||||||
| |||||||||||||||||
| Party | Candidate | Votes | % | |
|---|---|---|---|---|
| Democratic | Joshua B. Lee (Incumbent) | 493,407 | 67.97% | |
| Republican | Herbert K. Hyde | 229,004 | 31.55% | |
| Socialist | Edgar Clemons | 1,895 | 0.26% | |
| Prohibition | P. C. Nelson | 973 | 0.13% | |
| Independent | Frank M. Kimes | 344 | 0.05% | |
| Independent | R. M. Funk | 298 | 0.04% | |
| Majority | 264,403 | 36.42% | ||
| Turnout | 725,921 | |||
| Democratic hold | ||||
Oregon
| |||||||||||||||||
| |||||||||||||||||
 County results County resultsMcNary: 40-50% 50-60% 60-70% Mahoney: 40-50% 50-60% | |||||||||||||||||
| |||||||||||||||||
| Party | Candidate | Votes | % | |
|---|---|---|---|---|
| Republican | Charles L. McNary (Incumbent) | 199,332 | 49.69% | |
| Democratic | Willis Mahoney | 193,822 | 48.32% | |
| Independent | Albert Streiff | 3,134 | 0.78% | |
| Socialist Labor | Eric Hass | 2,886 | 0.72% | |
| Independent | Clarence Rudder | 1,956 | 0.49% | |
| None | Scattering | 1 | 0.00% | |
| Majority | 5,510 | 1.37% | ||
| Turnout | 401,131 | |||
| Republican hold | ||||
Rhode Island
See also: List of United States senators from Rhode Island| Party | Candidate | Votes | % | |
|---|---|---|---|---|
| Democratic | Theodore F. Green | 149,141 | 48.62% | |
| Republican | Jesse H. Metcalf (Incumbent) | 136,125 | 44.37% | |
| Independent | Ludger LaPointe | 21,495 | 7.01% | |
| Majority | 13,016 | 4.35% | ||
| Turnout | 306,761 | |||
| Democratic gain from Republican | ||||
South Carolina
| |||||||||||||||||
| |||||||||||||||||
 Results by county Results by countyByrnes: 50–60% 60–70% 70–80% 80–90% >90% | |||||||||||||||||
| |||||||||||||||||
| Party | Candidate | Votes | % | ±% | |
|---|---|---|---|---|---|
| Democratic | James F. Byrnes (Incumbent) | 113,696 | 98.6 | −1.4 | |
| Republican | Joseph Augustis Tolbert | 961 | 0.8 | N/A | |
| Republican | Marion W. Seabrook | 702 | 0.6 | N/A | |
| No party | Write-Ins | 1 | 0.0 | 0.0 | |
| Majority | 112,735 | 97.8 | −2.2 | ||
| Turnout | 115,360 | ||||
| Democratic hold | |||||
South Dakota
| |||||||||||||||||
| |||||||||||||||||
 County results County resultsBulow: 40–50% 50–60% 60–70% Gurney: 40–50% 50–60% 60–70% No Vote: | |||||||||||||||||
| |||||||||||||||||
| Party | Candidate | Votes | % | |
|---|---|---|---|---|
| Democratic | William J. Bulow (Incumbent) | 141,509 | 48.83% | |
| Republican | John Chandler Gurney | 135,461 | 46.75% | |
| Independent | Arthur Bennett | 12,816 | 4.42% | |
| Majority | 6,048 | 2.08% | ||
| Turnout | 289,786 | |||
| Democratic hold | ||||
Tennessee
| |||||||||||||||||
| |||||||||||||||||
| |||||||||||||||||
| Party | Candidate | Votes | % | |
|---|---|---|---|---|
| Democratic | Nathan L. Bachman (Incumbent) | 273,298 | 75.88% | |
| Republican | Dwayne D. Maddox | 69,753 | 19.37% | |
| Independent | John Randolph Neal Jr. | 14,617 | 4.06% | |
| Independent | Howard Kester | 2,516 | 0.70% | |
| Majority | 203,545 | 56.51% | ||
| Turnout | 360,184 | |||
| Democratic hold | ||||
Texas
| |||||||||||||||||
| |||||||||||||||||
 County Results County ResultsSheppard: 70–80% 80–90% >90% | |||||||||||||||||
| |||||||||||||||||
| Party | Candidate | Votes | % | ±% | |
|---|---|---|---|---|---|
| Democratic | Morris Sheppard (incumbent) | 774,975 | 92.56% | ||
| Republican | Carlos G. Watson | 59,491 | 7.11% | ||
| Union | Gertrude Wilson | 1,836 | 0.22% | N/A | |
| Socialist | William Burr Starr | 958 | 0.11% | ||
| Total votes | 837,260 | 100.00% | |||
| Democratic hold | |||||
Virginia
| |||||||||||||||||
| |||||||||||||||||
 County and independent city results County and independent city resultsGlass: 80–90% 90-100% | |||||||||||||||||
| |||||||||||||||||
| Party | Candidate | Votes | % | ±% | |
|---|---|---|---|---|---|
| Democratic | Carter Glass (inc.) | 244,518 | 91.66% | +14.99% | |
| Republican | George Rohken | 12,573 | 4.71% | +4.71% | |
| Communist | Donald Burke | 8,907 | 3.34% | +3.34% | |
| Independent Democratic | Elbert Lee Trinkle | 469 | 0.18% | −17.68% | |
| Independent | A. J. Dunning | 125 | 0.05% | ||
| Write-ins | 174 | 0.07% | +0.04% | ||
| Majority | 231,945 | 86.95% | +28.14% | ||
| Turnout | 266,766 | ||||
| Democratic hold | |||||
West Virginia
| |||||||||||||||||
| |||||||||||||||||
 County results County resultsNeely: 50–60% 60–70% 70–80% Shott: 50–60% 60–70% 70–80% | |||||||||||||||||
| |||||||||||||||||
| Party | Candidate | Votes | % | |
|---|---|---|---|---|
| Democratic | Matthew M. Neely (Incumbent) | 488,720 | 58.95% | |
| Republican | Hugh Ike Shott | 338,363 | 40.81% | |
| Prohibition | John Wesley MacDonald | 1,005 | 0.12% | |
| Socialist | J. H. Snider | 935 | 0.11% | |
| Majority | 150,357 | 18.14% | ||
| Turnout | 829,023 | |||
| Democratic hold | ||||
Wyoming
| |||||||||||||||||
| |||||||||||||||||
 County results County resultsSchwartz: 50–60% 60–70% 70–80% Carey: 50–60% 60–70% | |||||||||||||||||
| |||||||||||||||||
| Party | Candidate | Votes | % | |
|---|---|---|---|---|
| Democratic | Henry H. Schwartz | 53,919 | 53.83% | |
| Republican | Robert D. Carey (Incumbent) | 45,483 | 45.40% | |
| Union | George E. Geier | 682 | 0.68% | |
| Communist | Merton Willer | 88 | 0.09% | |
| Majority | 8,436 | 8.43% | ||
| Turnout | 100,172 | |||
| Democratic gain from Republican | ||||
See also
Notes
- ^ Appointee elected
- ^ The Republican candidate was elected to finish the term, but the Farmer-Labor candidate was elected to the next term.
- A South Dakota Republican, who was not up for election, died December 20, 1936, and a Democrat was appointed December 29, 1936, to continue the term pending a 1938 special election.
References
- "Our Campaigns - Container Detail Page". www.ourcampaigns.com.
- "Our Campaigns - MI US Senate - R Primary Race - Sep 15, 1936". www.ourcampaigns.com.
- "Our Campaigns - Container Detail Page". www.ourcampaigns.com.
- ^ "Statistics of the Congressional Election of November 3, 1936" (PDF). Clerk.house.gov. Retrieved July 21, 2019.
- "Our Campaigns - FL US Senate - Special D Primary Race - Aug 11, 1936". www.ourcampaigns.com.
- "Our Campaigns - FL US Senate - Special Race - Nov 03, 1936". www.ourcampaigns.com.
- "Our Campaigns - FL US Senate - Special Race - Nov 03, 1936". www.ourcampaigns.com. Retrieved August 22, 2020.
- "GA US Senate, 1936 - D Primary". Our Campaigns. Retrieved July 12, 2024.
- "TALMADGE BEATEN IN GEORGIA RACE". Atlanta. the Associated Press. September 10, 1936. Retrieved July 12, 2024 – via Chronicling America.
Russell 165,111 popular votes; 344 unit votes. Talmadge 86,203 popular votes, 66 unit votes.
- "OFFICIAL VOTE OF THE STATE OF ILLINOIS CAST AT THE GENERAL ELECTION, NOV. 3, 1936 PRIMARY ELECTIONS GENERAL PRIMARY, APRIL 14, 1936 PRESIDENTIAL PREFERENCE, APRIL 14, 19356" (PDF). Illinois State Board of Elections. Retrieved December 15, 2020.
- "General Election Returns for Minnesota / Tuesday, November Third 1936" (PDF). Minnesota Legislative Manual 1937.
- Heard, Alexander; Strong, Donald (1950). Southern Primaries and Elections 1920-1949. University of Alabama Press. pp. 174–177. ISBN 9780836955248.
- "Our Campaigns – TX US Senate Race – Nov 03, 1936". www.ourcampaigns.com.
| (1935←) 1936 United States elections (→1937) | |
|---|---|
| President | |
| U.S. Senate |
|
| U.S. House |
|
| State governors |
|
| State legislatures | |

