| Revision as of 11:18, 27 June 2023 edit177.142.138.240 (talk)No edit summary← Previous edit | Revision as of 11:42, 27 June 2023 edit undo2804:14d:5c87:8e8c:fcdc:83d1:73cc:8992 (talk) →Amusement parksNext edit → | ||
| Line 218: | Line 218: | ||
| == Amusement parks == | == Amusement parks == | ||
| In 2023, according to the "Best Amusement and Water Parks" ranking, from the "Travelers' Choice" award (the "Travelers' Choice", in English), from the ] website, Brazil had 4 of the 25 best |
In 2023, according to the "Best Amusement and Water Parks" ranking, from the "Travelers' Choice" award (the "Travelers' Choice", in English), from the ] website, Brazil had 4 of the 25 best ] in the world: ] (2nd), in Santa Catarina; ] (3rd), in Ceará; ] (13th), in Rio Grande do Sul; and {{ill|Hot Park|pt|Hot Park}} (18th), in Goiás.<ref></ref> | ||
| ==Paleontological tourism== | ==Paleontological tourism== | ||
Revision as of 11:42, 27 June 2023
Overview of tourism in Brazil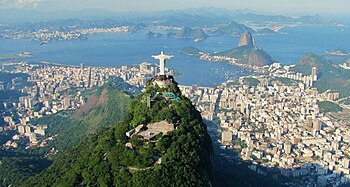


Tourism in Brazil is a growing sector and key to the economy of several regions of Brazil. The country had 6.589 million visitors in 2018, ranking in terms of the international tourist arrivals as the second main destination in South America after Argentina and third in Latin America after Mexico and Argentina. Revenues from international tourists reached US$5.8 billion in 2015, continuing a recovery trend from the 2008–2009 economic crisis.
Brazil offers for both domestic and international tourists an ample range of options, with natural areas being its most popular tourism product, a combination of leisure and recreation, mainly sun and beach, and adventure travel, as well as historic and cultural tourism. Among the most popular destinations are beaches at Rio de Janeiro and Santa Catarina, beaches and dunes in the Northeast Region, business trips to São Paulo city, cultural and historic tourism in Minas Gerais, the Iguazu Falls and the Pantanal in the Center-West Region.
In terms of the 2015 Travel and Tourism Competitiveness Index (TTCI), which is a measurement of the factors that make it attractive to develop business in the travel and tourism industry of individual countries, Brazil ranked in the 28th place at the world's level, third in the Americas, after Canada and United States. Brazil main competitive advantages are its natural resources, which ranked 1st on this criteria out of all countries considered, and ranked 23rd for its cultural resources, due to its many World Heritage Sites. The 2013 TTCI report also notes Brazil's main weaknesses: its ground transport infrastructure remains underdeveloped (ranked 129th), with the quality of roads ranking in the 121st place, and quality of air transport infrastructure in 131st; and the country continues to suffer from a lack of price competitiveness (ranked 126th), due in part to high and increasing ticket taxes and airport charges, as well as high and rising prices more generally. Safety and security improved significantly between 2008 and 2013, moving from 128th to 73rd place, before slipping to 106th by 2017.
Foreign tourists mainly come from Argentina, Uruguay, Paraguay, Bolivia, Peru, Ecuador, Colombia, Venezuela, Costa Rica, Mexico, Cuba, the Dominican Republic, the United States, Canada, China, South Korea, Japan, Australia, Chile, Spain, Italy, France, Germany, the United Kingdom, Greece, Ireland, the Netherlands, Belgium, Switzerland, Portugal, and Russia.
International tourism
| Historical international tourism arrivals 1995-2019 | ||||
|---|---|---|---|---|
| Year | International tourist arrivals (x1000) |
Annual growth (%) |
Total revenue (millions USD) |
Annual growth (%) |
| 1995 | 1,991 | - | 972 | - |
| 2000 | 5,313 | - | 1,810 | - |
| 2003 | 4,133 | - | 2,479 | - |
| 2004 | 4,794 | 16.0 | 3,222 | 30.0 |
| 2005 | 5,358 | 11.8 | 3,861 | 19.8 |
| 2006 | 5,019 | -6.3 | 4,316 | 1.1 |
| 2007 | 5,025 | 0.1 | 4,953 | 14.8 |
| 2008 | 5,050 | 0.5 | 5,780 | 16.7 |
| 2009 | 4,802 | -4.9 | 5,305 | -8.2 |
| 2010 | 5,161 | 7.5 | 5,702 | 7.5 |
| 2011 | 5,433 | 5.3 | 6,555 | 14.9 |
| 2012 | 5,677 | 4.5 | 6,645 | 1.3 |
| 2013 | 5,813 | 2.4 | 6,704 | 0.9 |
| 2014 | 6,430 | n/a | n/a | n/a |
| 2015 | 6,306 | n/a | n/a | n/a |
| 2016 | 6,578 | n/a | n/a | n/a |
| 2017 | 6,589 | 0.6 | 5,809 | n/a |
| 2018 | 6,621 | 0.5 | 5,921 | n/a |
| 2019 | 6,353 | -4.4 | 5,995 | n/a |
According to the World Tourism Organization), international travel to Brazil began to grow fast since 2000, particularly during 2004 and 2005. However, in 2006 a slow down took place, and international arrivals have had almost no growth both in 2007 and 2008. In spite of this trend, revenues from international tourism continued to rise, from USD 3.9 billion in 2005 to USD 4.9 billion in 2007, a one billion dollar increase despite 333 thousand less arrivals. This favorable trend is the result of the strong devaluation of the American dollar against the Brazilian real, which began in 2004, but on the other hand, making Brazil a more expensive international destination. This trend changed in 2009, when both visitors and revenues fell as a result of the 2008-2009 economic crisis. By 2010, the industry recovered, and arrivals grew above 2006 levels to 5.16 million international visitors, and receipts from these visitors reached USD 5.9 billion. In 2012, the historical record was reached with 5.6 million visitors and US$6.6 billion in receipts.
Despite continuing record breaking of international tourism revenues, the number of Brazilian tourists travelling overseas has been growing steadily since 2003, resulting in a net negative foreign exchange balance, as more money is spent abroad by Brazilian than receipts from international tourist visiting Brazil. Tourism expenditures abroad grew from USD 5.76 billion in 2006, to USD 8.21 billion in 2007, a 42,45% increase, representing a net deficit of USD 3.26 billion in 2007, as compared to USD 1.45 billion in 2006, a 125% increase from the previous year. This trend is caused by Brazilians taking advantage of the stronger Real to travel and making relatively cheaper expenditures abroad. Brazilian traveling overseas in 2006 represented 3.9% of the country's population.
In 2005, tourism contributed with 3.2% of the country's revenues from exports of goods and services, and represented 7% of direct and indirect employment in the Brazilian economy. In 2006, direct employment in the sector reached 1.87 million people. Domestic tourism is a fundamental market segment for the industry, as 51 million traveled throughout the country in 2005, and direct revenues from Brazilian tourists reached USD 21.8 billion, 5.6 times more receipts than international tourists in 2005.
In 2005, Rio de Janeiro, Foz do Iguaçu, São Paulo, Florianópolis, and Salvador were the most visited cities by international tourists for leisure trips. The most popular destinations for business trips were São Paulo, Rio de Janeiro, and Porto Alegre. In 2006, Rio de Janeiro and Fortaleza were the most popular destinations by national visitors.
| Main destinations visited by international leisure tourists in 2019 Top 15 ranking by number of visitors | |||||||
|---|---|---|---|---|---|---|---|
| Ranking (2019) |
Destination | State | |||||
| 1st | Rio de Janeiro | RJ | |||||
| 2nd | Florianópolis | SC | |||||
| 3rd | Foz do Iguaçu | PR | |||||
| 4th | São Paulo | SP | |||||
| 5th | Armação dos Búzios | RJ | |||||
| 6th | Salvador | BA | |||||
| 7th | Bombinhas | SC | |||||
| 8th | Angra dos Reis | RJ | |||||
| 9th | Balneário Camboriú | SC | |||||
| 10th | Paraty | RJ | |||||
| 11th | Ipojuca | PE | |||||
| 12th | Natal | RN | |||||
| 13th | Cairu | BA | |||||
| 14th | Fortaleza | CE | |||||
| 15th | Itapema | SC | |||||
| Main destinations visited by national leisure tourists in 2020 Top 10 ranking by number of visitors | |||||||
|---|---|---|---|---|---|---|---|
| Ranking (2020) |
Destination | State | |||||
| 1st | Rio de Janeiro | RJ | |||||
| 2nd | São Paulo | SP | |||||
| 3rd | Maceió | AL | |||||
| 4th | Gramado | RS | |||||
| 5th | Fortaleza | CE | |||||
| 6th | Natal | RN | |||||
| 7th | Foz do Iguaçu | PR | |||||
| 8th | Porto de Galinhas | PE | |||||
| 9th | Salvador | BA | |||||
| 10th | Florianópolis | SC | |||||
Arrivals by country of origin
| Top 20 visitor arrivals to Brazil by country of origin in 2016 - 2020 | |||||||||
|---|---|---|---|---|---|---|---|---|---|
| Ranking 2020 |
Country of origin |
Visitor arrivals 2020 |
Visitor arrivals 2016 |
% Total increase/decrease |
Ranking 2020 |
Country of origin |
Visitor arrivals 2020 |
Visitor arrivals 2016 |
% Total increase/decrease |
| 1 | 887,805 | 2,294,900 | 11 | 45,449 | 138,106 | ||||
| 2 | 172,105 | 570,350 | 12 | 33,895 | 147,846 | ||||
| 3 | 131,174 | 311,813 | 13 | 32,665 | 114,276 | ||||
| 4 | 122,981 | 316,714 | 14 | 27,129 | 135,192 | ||||
| 5 | 113,714 | 284,113 | 15 | 26,950 | 70,103 | ||||
| 6 | 70,369 | 263,774 | 16 | 20,476 | 79,754 | ||||
| 7 | 61,149 | 221,513 | 17 | 18,195 | 34,962 | ||||
| 8 | 51,028 | 149,968 | 18 | 18,068 | 94,609 | ||||
| 9 | 48,595 | 202,671 | 19 | 17,932 | 49,809 | ||||
| 10 | 45,646 | 181,493 | 20 | 17,063 | 69,074 | ||||
| Visitor arrivals by region of origin in 2020 (Top 4) | |||||||||
| 1 | South America | 1,383,550 | 3,732,722 | 3 | North America | 217,123 | 735,062 | ||
| 2 | Europe | 430,166 | 1,606,495 | 4 | Asia | 70,081 | 304,786 | ||
Comparison with other Latin American destinations
The following is a comparative summary of Brazil's tourism industry key performance indicators as compared with countries considered among the most popular destinations in Latin America, and relevant economic indicators are included to show the relative importance that international tourism has on the economy of the selected countries.
| Selected Caribbean and Latin American countries |
Internl. tourist arrivals 2012 (x1000) |
Internl. tourism receipts 2012 (million USD) |
Receipts per arrival 2012 (col 2)/(col 1) (USD) |
Arrivals per capita per 1000 pop. (estimated) 2007 |
Receipts per capita 2005 USD |
Revenues as % of exports goods and services 2003 |
Tourism revenues as % GDP 2012 |
% Direct & indirect employment in tourism 2012 |
World Ranking Tourism Compet. TTCI 2013 |
Index value TTCI 2013 |
|---|---|---|---|---|---|---|---|---|---|---|
| 5,599 | 4,895 | 874 | 115 | 57 | 7.4 | 10.5 | 9.9 | 61 | 4.17 | |
| 5,677 | 6,645 | 1,170 | 26 | 18 | 3.2 | 8.9 | 8.1 | 51 | 4.37 | |
| 3,554 | 2,201 | 619 | 151 | 73 | 5.3 | 8.4 | 8.0 | 56 | 4.29 | |
| 2,175 | 2,351 | 1,081 | 26 | 25 | 6.6 | 5.1 | 5.5 | 84 | 3.90 | |
| 2,343 | 2,425 | 1,035 | 442 | 343 | 17.5 | 12.5 | 11.7 | 47 | 4.44 | |
| 2,688 | 2,283 | 849 | 188 | 169 | n/d | n/d | n/d | n/d | n/d | |
| 4,563 | 4,549 | 997 | 408 | 353 | 36.2 | 14.7 | 13.6 | 86 | 3.88 | |
| 1,986 | 2,043 | 1,029 | 628 | 530 | 49.2 | 25.7 | 23.8 | 67 | 4.08 | |
| 23,403 | 12,739 | 544 | 201 | 103 | 5.7 | 12.4 | 13.7 | 44 | 4.46 | |
| 1,606 | 2,259 | 1,406 | 330 | 211 | 10.6 | 10.1 | 9.6 | 37 | 4.54 | |
| 2,846 | 2,657 | 933 | 65 | 41 | 9.0 | 9.1 | 7.8 | 73 | 4.00 | |
| 2,695 | 2,076 | 770 | 525 | 145 | 14.2 | 10.2 | 9.7 | 59 | 4.23 |
- Notes: Green shadow denotes the country with the top indicator. Yellow shadow corresponds to Brazilian indicators.
(1) Visitors and receipts for Cuba correspond to 2011.
Tourist visa
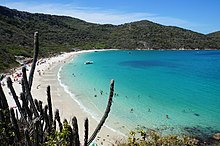
Tourist visa requirements have been waived for citizens of Andorra, Argentina, Australia, Austria, Bahamas, Barbados, Belarus, Belgium, Bolivia, Bulgaria, Canada, Chile, Colombia, Costa Rica, Croatia, Czech Republic, Denmark, Ecuador, Finland, France, Germany, Greece, Guatemala, Guyana, Hong Kong, Hungary, Iceland, India, Ireland, Israel, Italy, Japan, Liechtenstein, Lithuania, Luxembourg, Macau, Malaysia, Malta, Mexico, Monaco, Namibia, Netherlands, New Zealand, Norway, Panama, Paraguay, Peru, Philippines, Poland, Portugal, Qatar, Romania, Russia, San Marino, Singapore, Slovakia, Slovenia, South Africa, South Korea, Spain, Suriname, Sweden, Switzerland, Thailand, Trinidad and Tobago, Turkey, Ukraine, the United Kingdom, the United States, Uruguay, Vatican City, and Venezuela.
Tourist visas also applies to lecturers at conferences, for visiting relatives and/or friends, unpaid participation in athletic or artistic event or competition (in this case an invitation letter from the sponsoring organization in Brazil is required), and unpaid participation in a scientific/academic seminar or conference sponsored by a research or academic institution (in this case, an invitation letter from the sponsoring organization in Brazil is required).
Amusement parks
In 2023, according to the "Best Amusement and Water Parks" ranking, from the "Travelers' Choice" award (the "Travelers' Choice", in English), from the TripAdvisor website, Brazil had 4 of the 25 best entertainment parks in the world: Beto Carrero World (2nd), in Santa Catarina; Beach Park (3rd), in Ceará; Terra Mágica Florybal Park (13th), in Rio Grande do Sul; and Hot Park [pt] (18th), in Goiás.
Paleontological tourism

Geopark Paleorrota is the main area of geotourism in Rio Grande do Sul and one of the most important in Brazil. With 83,000 km (32,000 sq mi) inside 281,000 km (108,000 sq mi) of the state, where many fossils of the Permian and Triassic period, with ages ranging between 210 and 290 million years ago, when there were only the continent Pangaea.
In the region Metropolitan Porto Alegre there are 5 museums to visit. In Paleorrota Geopark there are 7 museums, the Palaeobotanical Garden in Mata and the Paleontological Sites of Santa Maria to be visited. The BR-287, nicknamed Highway of Dinosaurs, crosses 17 of 41 municipalities of the geopark.
Ecotourism

Bonito, in Mato Grosso do Sul, is considered the Brazilian capital of ecotourism. This type of tourism also occurs in places like Pantanal and Amazon rainforest, Brotas, Cambará do Sul, Canela, Caravelas, Chapada Diamantina, Chapada dos Veadeiros, Ilha Grande, Ilha do Mel, Iporanga, Itacaré, Itatiaia, Itaúnas State Park, Jalapão, Jericoacoara, Monte Verde, Morro de São Paulo, Pirenópolis, Socorro, Ubatuba and many others.
Domestic tourism

Domestic tourism is a key market segment for the tourism industry in Brazil. In 2005, 51 million Brazilian nationals made ten times more trips than foreign tourists and spent five times more money than their international counterparts. The main destination states in 2005 were São Paulo (27.7%), Minas Gerais (10.8%), Rio de Janeiro (8.4%), Bahia (7.4%), and Santa Catarina (7.2%). The top three states by trip origin were São Paulo (35.7%), Minas Gerais (13.6%).
In terms of tourism revenues, the top earners by state were São Paulo (16.4%) and Bahia (11.7%). For 2005, the three main trip purposes were visiting friends and family (53.1%), sun and beach (40.8%), and cultural tourism (12.5%).
Tourism by regions of Brazil

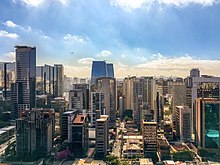

Southeast Region
- Rio de Janeiro: Rio de Janeiro, Angra dos Reis, Paraty, Resende, Visconde de Mauá, Itatiaia National Park, Petrópolis, Vassouras, Teresópolis, Serra dos Órgãos, Nova Friburgo, Saquarema, Arraial do Cabo, Cabo Frio, Búzios, Ilha Grande
- Espírito Santo: Vitória, Vila Velha, Guarapari, Anchieta, Piúma, Marataízes, São Mateus, Conceição da Barra, Domingos Martins, Santa Teresa
- Minas Gerais: Belo Horizonte, Sabará, Ouro Preto, Congonhas, Mariana, Lavras, São João del-Rei, Tiradentes, Diamantina, Serro, Araxá, Caxambu, São Lourenço, São Thomé das Letras, Capitólio, Camanducaia, Caparaó National Park, Pico da Bandeira, Serra do Cipó National Park, Serra da Canastra National Park
- São Paulo: São Paulo, São Sebastião, Ilhabela, Boiçucanga, Poá, Guararema, Guarujá, Santos, Iguape, Cananéia, São Vicente, Campos do Jordão, Holambra, Campinas, Ribeirão Preto, São José dos Campos, Sorocaba, Americana, Araçatuba, Araraquara, Araras, Atibaia, Barretos, Birigüi, Botucatu, Bragança Paulista, Itu, Jaú
Southern Region
- Paraná: Curitiba, Morretes, Antonina, Paranaguá, Ilha do Mel, Superagui National Park, Foz do Iguaçu, Iguaçu Falls, Guaratuba
- Santa Catarina: Florianópolis, Santa Catarina Island, Joinville, Blumenau, Itapema, Itajaí, Balneário Camboriú
- Rio Grande do Sul: Porto Alegre, Torres, Aparados da Serra National Park, Serra Gaúcha, Canela, Gramado, Paleorrota
Center-West Region
- Federal District: Brasília
- Goiás: Goiânia, Chapada dos Veadeiros National Park, Pirenópolis, Goiás Velho, Caldas Novas, Emas National Park, Araguaia River
- Mato Grosso: Cuiabá, The Pantanal, Chapada dos Guimarães National Park, Tangará da Serra Waterfall Leap of the Clouds (Salto das Nuvens), Barra do Garças, Alta Floresta, Cáceres, Barão de Melgaço, Poconé
- Mato Grosso do Sul: Campo Grande, Corumbá, Bonito, Ponta Porã, Aquidauana, Coxim, Jardim
Northeast Region
- Bahia: Salvador, Cachoeira, Lençóis, Morro de São Paulo, Ilhéus, Itacaré, Porto Seguro, Arraial d'Ajuda, Trancoso, Chapada Diamantina National Park, Abrolhos Marine National Park
- Pernambuco: Recife, Olinda, Itamaracá, Igarassu, Caruaru, Porto de Galinhas, New Jerusalem, Garanhuns, Triunfo, Fernando de Noronha, Catimbau Valley, Petrolina
- Ceará: Fortaleza, Aracati, Canoa Quebrada, Jericoacoara, Tatajuba, Camocim, Sobral, Baturité, Ubajara National Park, Juazeiro do Norte
- Sergipe: Aracaju, Laranjeiras, São Cristóvão, Estância, Propriá
- Alagoas: Maceió, Maragogi, Penedo, Barra de São Miguel, Paripueira, Porto de Pedras
- Paraíba: João Pessoa, Campina Grande, Cabedelo, Ingá, Baía da Traição, Sousa
- Rio Grande do Norte: Natal, Mossoró, Tibau do Sul, Tibau, Parnamirim, Touros, São Miguel do Gostoso, Galinhos, Caicó, Macau, Martins, Maxaranguape, Cape São Roque
- Piauí: Teresina, Sete Cidades National Park, Parnaíba, Serra da Capivara National Park
- Maranhão: São Luís, Lençóis Maranhenses National Park, Alcântara, Imperatriz, Carolina
North Region
- Amazonas: Manaus, Parintins, Tefé, Mamirauá
- Pará: Belém, Marajó Island, Santarém
- Tocantins: Palmas, Ilha do Bananal, Natividade
- Amapá: Macapá, Oiapoque
- Roraima: Boa Vista, Monte Roraima
- Rondônia: Porto Velho, Guajará-Mirim, Guaporé Valley
- Acre: Rio Branco, Xapuri, Brasiléia, Assis Brasil
Gallery
-
 Ponta Negra beach in Natal, Rio Grande do Norte
-
Beto Carrero World, in Santa Catarina
-
 Gramado, in Rio Grande do Sul, is one of the most sought after for domestic tourism in Brazil
-
 Armação dos Búzios in Rio de Janeiro State
-
 Pantanal in Mato Grosso
-
 Bonito in Mato Grosso do Sul
-
 Hiking in Serra do Rio do Rastro, Santa Catarina
-
 Swiss village in Campos do Jordão, São Paulo State
-
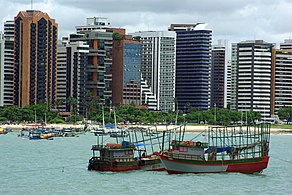 Fortaleza, Ceará
-
 Paraty in Rio de Janeiro State
-
 Vineyards valley in Rio Grande do Sul
-
 Balneário Camboriú
-
 Boa Viagem beach in Recife
-
 Mel Island in Paraná
-
 A resort in Porto de Galinhas
-
 Chapada Diamantina in Bahia
-
 The Basilica of Our Lady of Aparecida is the second largest Catholic church in the world in interior area after the St. Peter's Basilica in the Vatican City.
- Ponta Verde beach in Maceió Ponta Verde beach in Maceió
-
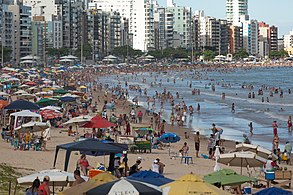 Guarapari
-
Serra da Capivara National Park in Piauí
See also
References
- O Globo (18 March 2014). "Praia de Fernando de Noronha é eleita a mais bonita do mundo". Retrieved 4 January 2018.
- UNWTO Tourism Highlights, 2016 Edition. 2016. doi:10.18111/9789284418145. ISBN 9789284418145.
- ^ "UNWTO Tourism Highlights, 2013 Edition" (PDF). World Tourism Organization (UNWTO). June 2013. Archived from the original (PDF) on 2013-11-27. Retrieved 2014-04-14. pp. 10
- ^ Statistical Yearbook for Tourism 2020 base year 2019, page 331 of the PDF file (in Portuguese)
- "The Travel & Tourism Competitiveness Report 2015" (PDF). World Economic Forum. May 2015.
- ^ Jennifer Blanke and Thea Chiesa, ed. (2013). "Travel & Tourism Competitiveness Report 2013" (PDF). World Economic Forum, Geneva, Switzerland. Retrieved 2013-04-14. See Table 4, pp. 18-19 and Country/Economy Profile: Brazil, pp. 116-117.
- "The Travel & Tourism Competitiveness Report 2017" (PDF). World Economic Forum. April 2017.
- ^ World Tourism Organization (2005). "Tourism Market Trends, Annex 5, 2005 Edition" (PDF). Archived from the original (PDF) on 2007-02-20. Retrieved 2008-03-30.
- ^ World Tourism Organization (2006). "Tourism Market Trends, Annex 12, 2006 Edition" (PDF). (Data corresponds to 2005). Retrieved 2008-03-30.
- ^ World Tourism Organization (2007). "UNWTO Tourism Highlights, Edition 2007" (PDF). UNWTO. Archived from the original (PDF) on 2013-04-09. Retrieved 2008-06-14.
- EMBRATUR (2008). "Principais Emissores de Turistas para o Brasil 2006-2007" (in Portuguese). Ministério de Turismo. Archived from the original on 2011-05-29. Retrieved 2008-06-19.
- Facultade Getúlio Vargas (2008). "Boletim de Desempenho Econômico do Turismo" (in Portuguese). Ministério de Turismo. Archived from the original on 2011-05-29. Retrieved 2008-06-19. Janeiro 2008, Ano v, nº 17, pp. 2
- ^ EMBRATUR (2009). "Anuário Estatístico de Turismo 2009" (in Portuguese). Ministério de Turismo. Retrieved 2008-09-05. See tables 1.1 and 3.8
- Adair de Oliveira Júnior (2009-01-27). "Gasto de turistas estrangeiros registra recorde em 2008". Centro de Excelência em Turismo, UNB. Retrieved 2008-02-01. Source Brazilian Central Bank
- ^ "UNTWO Tourism Highlights 2010 Edition". World Tourism Organization. 2010. Archived from the original on 2013-06-07. Retrieved 2010-10-31. Click on the link "UNWTO Tourism Highlights" to access the pdf report.
- ^ "UNWTO Tourism Highlights - 2011 Edition" (PDF). World Tourism Organization. June 2011. Retrieved 2011-09-29.
- "UNWTO Tourism Highlights, 2015 Edition. World Tourism Organization (UNWTO). 2015. doi:10.18111/9789284416899. ISBN 9789284416899. Archived from the original on 2017-10-24. Retrieved 2017-11-15. pp.10
- ^ UNWTO Tourism Highlights: 2018 Edition. World Tourism Organization - UNWTO. 2018. p. 17. doi:10.18111/9789284419876. ISBN 9789284419876. S2CID 240334031. Retrieved 2022-03-02.
{{cite book}}:|website=ignored (help) - ^ International Tourism Highlights, 2020 Edition. World Tourism Organization - UNWTO. 2021. p. 19. doi:10.18111/9789284422456. ISBN 9789284422456. S2CID 241729455. Retrieved 2022-03-02.
{{cite book}}:|website=ignored (help) - ^ World Tourism Organization (2008). "UNWTO World Tourism Barometer June 2008" (PDF). UNWTO. Archived from the original (PDF) on 2008-10-31. Retrieved 2008-08-08. Data corresponds to 2007
- The World Tourism Organization. "Tourism Highlights 2006 [pdf]" (PDF). Archived from the original (PDF) on 2007-06-28. Retrieved 2006-01-06.
- Facultade Getúlio Vargas (2007). "Boletim de Desempenho Econômico do Turismo" (PDF) (in Portuguese). Ministério de Turismo. Archived from the original (PDF) on 2008-10-03. Retrieved 2008-06-21. Fevereiro 2007, Ano IV, nº 13, pp. 3
- ^ Facultade Getúlio Vargas (2008). "Pesquisa Anual de Conjuntura Econômica do Turismo" (PDF) (in Portuguese). Ministério de Turismo. Archived from the original (PDF) on 2008-10-03. Retrieved 2008-06-22. Março 2008, Ano IV, pp. 11
- ^ Fundação Instituto de Pesquisas Econômicas e EMBRATUR (2006). "Caracterização e Dimensionamento do Turismo Domêstico no Brasil 2002 e 2006: Metodologia e Desenvolvimento" (PDF) (in Portuguese). Ministério do Turismo. Archived from the original (PDF) on 2006-11-30. Retrieved 2008-06-22.
- ^ Carmen Altés (2006). "El Turismo en América Latina y el Caribe y la experiencia del BID" (in Spanish). Inter-American Development Bank; Sustainable Development Department, Technical Paper Series ENV-149, Washington, D.C. p. 9 and 47. Retrieved 2008-06-14.
- Margerida Coelho (2008). "Distribução Espacial da Ocupação no Setor de Turismo: Brasil e Regiões" (PDF) (in Portuguese). Instituto de Pesquisa Econômica Aplicada. Retrieved 2008-06-22.
- ^ Fundação Instituto de Pesquisas Econômicas (2007). "Caracterização e Dimensionamento do Turismo Domêstico no Brasil 2002 e 2006" (PDF) (in Portuguese). Ministério do Turismo. Archived from the original (PDF) on 2008-10-03. Retrieved 2008-06-21.
- Diretoria de Turismo (2006). "Boletim Anual São Paulo Turismo" (PDF) (in Portuguese). Prefeitura de São Paulo. Retrieved 2008-11-20. see 2.1.3 "Receitas setor trurístico 2005".
- EMBRATUR (2006). "Anúario Estatístico Volume 33 2006" (PDF) (in Portuguese). Ministério do Turismo. Archived from the original (PDF) on 2008-09-09. Retrieved 2008-06-22. Tables 4.1 a 4.4: Summary Brasil by trip purpose 2004-2005
- "Aguarde, estamos redirecionando o site". Turismoemfoco.com.br. Retrieved 2013-10-02.
- Rio de Janeiro was the most sought after city by Brazilians in 2020 (in Portuguese)
- ^ "Anuário Estatístico de Turismo 2021 (Ano base 2020) - 1ª Edição" (PDF). Subsecretaria de Gestão Estratégica - SGE, Ministério do Turismo - MTur. November 2021. pp. 16, 17. Retrieved 1 March 2022.
- ^ "Anuário Estatístico de Turismo 2017 - Ano Base 2016". Archived from the original on 2017-09-09. Retrieved 2017-09-09.
- United Nations. "UNData. Country profiles (1999-2005)". Retrieved 2008-08-08. Population estimated for 2007 (search values for each country profile)
- "Tourist Via - Brazil". Archived from the original on 2015-01-15. Retrieved 2014-09-15.
- Melhores parques de diversões do mundo: Brasil emplaca 4 no ranking de 2023 de site de viagens
- Bonito é eleito o Melhor Destino de Ecoturismo do Brasil pela 16ª vez
- Sustainable travel and ecotourism in Brazil
- Ozorio, Rodrigo Zomkowski; Janér, Ariane (2013). "Community-Based Ecotourism in the Mamirauá Reserve: Evaluation of product quality and reflections regarding the economic and financial feasibility of the activity". Scientific Magazine Uakari. 8 (2): 95–114. doi:10.31420/uakari.v8i2.141.
- The 50 best ecotourism destinations in Brazil
External links
- Brazilian Tourism Portal by Embratur (Brazilian Tourist Board)
- New York Times Travel Guides: Brazil
| Brazil articles | |||||||
|---|---|---|---|---|---|---|---|
| History | |||||||
| Geography | |||||||
| Politics | |||||||
| Economy |
| ||||||
| Society |
| ||||||
| Economy of Brazil | |
|---|---|
| History | |
| Agriculture | |
| Welfare | |
| Energy | |
| Other sectors | |
| Misc. | |
| Tourism in South America | |
|---|---|
| Sovereign states | |
| Dependencies and other territories | |